SSD Plots
Back to: Species Sensitivity Distributions (SSDs)
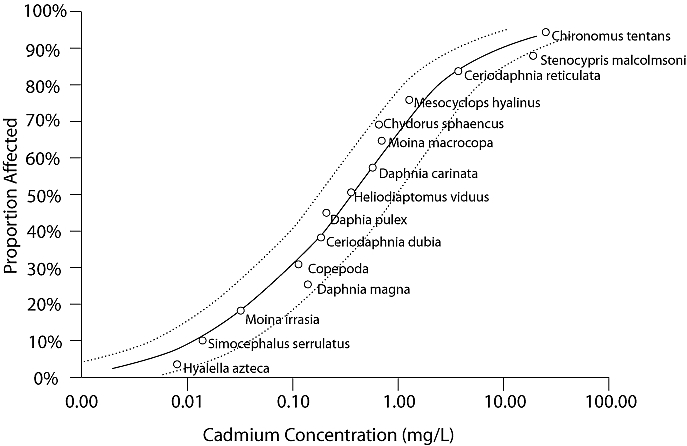
Figure 1
An SSD plot showing the distribution of LC50s for arthropod species exposed to dissolved cadmium at greater than 15°C over 48-72 h, with 95% confidence intervals (dotted lines). Data obtained from U.S. EPA's ECOTOX database.

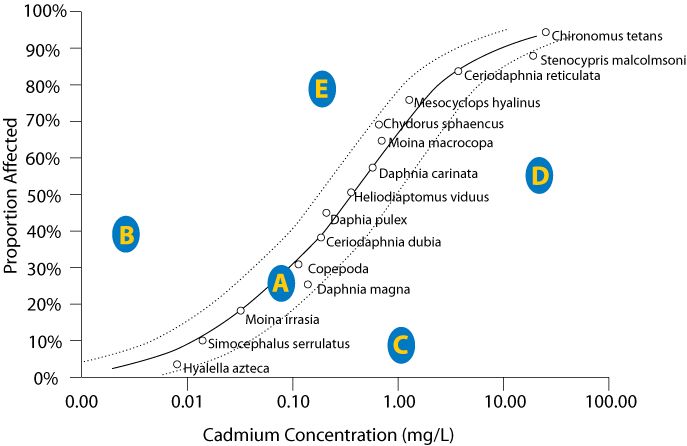
Figure 2
An SSD plot depicting five hypothetical sites (A-E) with different observed concentrations of cadmium and different proportions of species affected. Higher values on the Y-axis reflect a more severe effect.

