Time-Domain/Transient Electromagnetics (TDEM/TEM)
Basic Concept
Transient electromagnetic (TEM) methods, which are alternatively known as time-domain electromagnetics (TDEM), detect variations in subsurface electrical resistivity by using a few basic electromagnetic (EM) principles. TEM methods induce electric current flow within the subsurface and, after the transmitted signal is shut off, measure a voltage signal that is returned from the earth materials. The returning signal is measured as a function of time, and data are inverted to recover a layered earth model of resistivity.
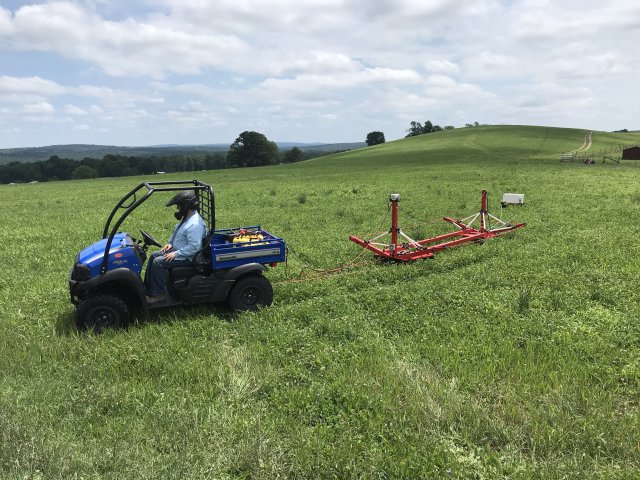
Transient electromagnetic methods are noninvasive and do not require direct electrical contact (i.e., galvanic coupling) with the ground. Thus, it is ideal for moving or aerial surveys as well as for use at sites with very resistive surface layers. Depths of investigation (DOI) vary from tens to hundreds of meters below land surface depending on certain parameters (e.g., geoelectric subsurface properties, transmit/measurement time, wire loop size, etc.).
Theory
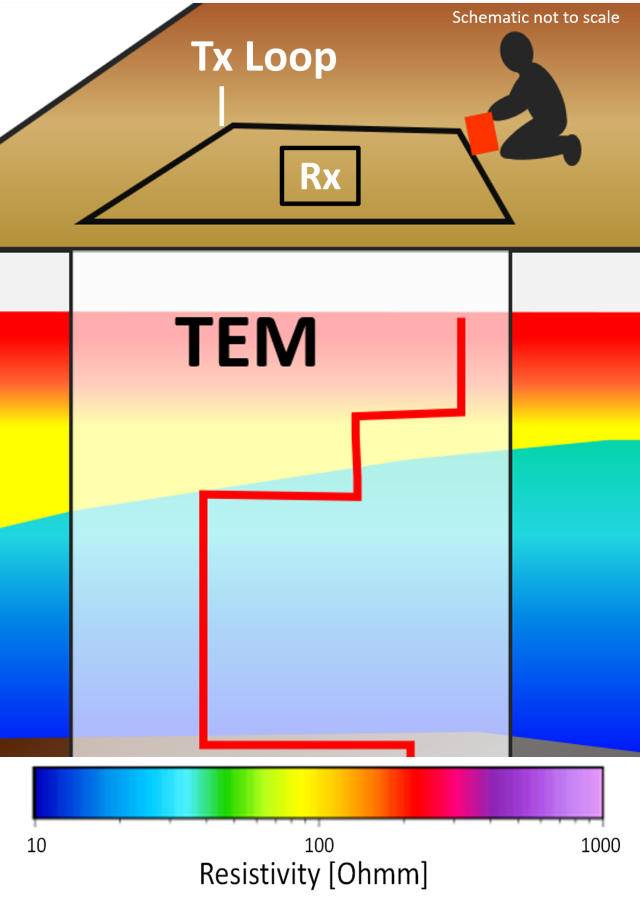
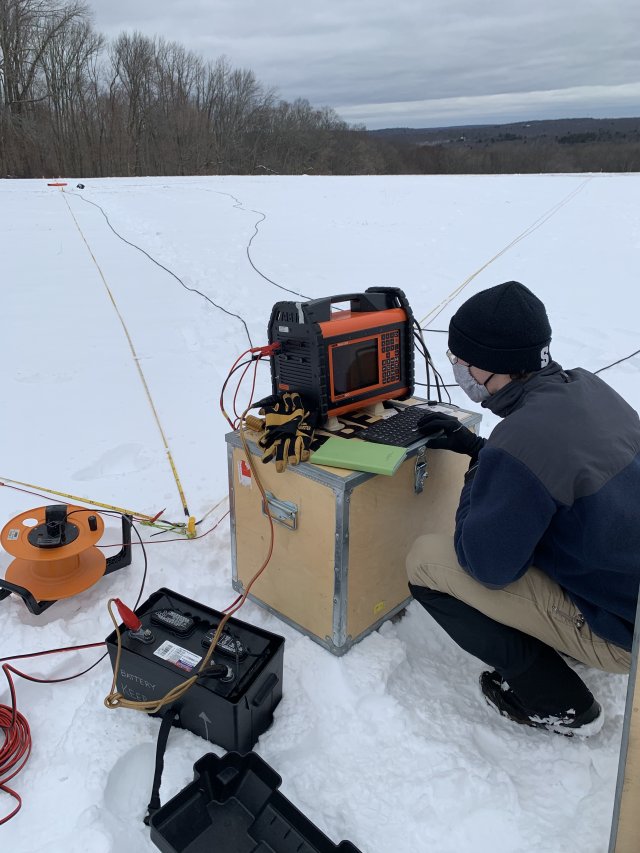
A basic TEM setup requires a single-turn transmitter wire loop and a multi-turn receiver wire coil. The wires are typically arranged in concentric squares because of the areal resemblance to circles of similar size and ease of field operation. The transmitter outputs a time-varying direct electrical current, which is typically a modified symmetrical square wave, into the transmitter coil. During signal transmission, the current through the closed transmitter loop creates a primary magnetic field that penetrates the subsurface.
This time-varying magnetic field induces an electromotive force (emf) and subsequent current flow (i.e., eddy current) within subsurface conductors. The induced eddy current generates a secondary magnetic field that opposes the primary field direction and is measured by the receiver coil. Signal transmission is transient, and there periodically exist moments absent of signal. Data are collected during the downtimes between the bipolar signal transmissions as the electromagnetic energy dissipates into the subsurface.
Current transmission ends abruptly and induces only short duration emf pulses. This generates a series of smoke ring-like eddy currents that are parallel to and beneath the transmitter loop. The currents penetrate down- and outward while losing amplitude due to material interactions and primary magnetic field dissipation. The decaying current travels through the subsurface and induces voltage pulses in subsurface conductors, which generates more current flow. This cycle continues until the current becomes unmeasurable or decays completely (Nabighian, 1979).
The induced eddy currents pass more slowly through conductive materials, which generates higher current flow and results in a slower decay of the secondary magnetic field. The currents pass through resistive materials quickly. This causes an increase in current attenuation and a faster decay of the secondary magnetic field. The receiver coil is energized by the decaying secondary magnetic field. Thus, the decay trend over time depends on and can be used to determine the variations of subsurface geoelectrical properties with depth (Figure 1).

Applications
The inversion of transient electromagnetic data uses multiple soundings to produce al one-dimensional (1-D) electrical resistivity profile with the depth. Each vertical profile is assumed to be located directly beneath the center of the concentric transmitter/receiver loops. Profiles can be combined to display data as two-dimensional cross-sections or three-dimensional volumes.
A variety of TEM equipment is available allowing for stationary, mobile, and aerial surveys. Transmitter loops are available in many sizes, and the standard stationary, land-based surveys employ loops with 20-, 40- or 100-meter side lengths. TEM depths of investigation vary by an order of magnitude, and, generally, larger loops and longer transmission times increase the DOI.
The use of TEM methods in environmental applications is increasing with advancements in method technology and ease of operation. TEM is ideal for imaging conductive bodies within resistive media. However, the success of the method is challenged when the target is a resistive body within a conductive medium or when there is a highly conductive surface layer. Furthermore, though the thickness of resistive layers can be identified, the actual resistivity value cannot be determined. (Fitterman, 1987).
That noted, TEM methods can be used to recover earth resistivity in the following applications:
-
Geologic mapping conductive layers or a conductive interface
-
Groundwater prospecting
-
Mineral exploration surveys
-
Salt-water intrusion
-
Mapping of electrically conductive contamination


Examples/Case studies
Baawaain, M.S., Al-Futaisi, A.M., Ebrahimi, A., and Omidvarborna, H., 2018, Characterizing leachate contamination in a landfill site using Time Domain Electromagnetic (TDEM) imaging: Journal of Applied Geophysics, v. 151, p. 73-81, doi:10.1016/j.jappgeo.2018.02.002.
Abstract: Time Domain Electromagnetic (TDEM) survey as well as drilling investigations were conducted to identify possible contamination of a dumping site in an unsaturated zone located in Barka, Oman. The method was applied to evaluate conductivity of the contaminated plumes in hot and arid/semiarid region, where high temperatures commonly ranged between 35 and 50 °C. The drilling investigation was carried out over the survey area to verify the geophysical results. The low-resistivity zone (<80 Ωm), encountered near the subsurface, indicated plume migration caused by liquid waste disposal activities. The combination of TDEM survey results with the lithology of piezometers showed that higher resistivity (>90 Ωm) was correlated with compacted or cemented gravels and cobbles, particularly that of medium dense to very dense gravels and cobbles. Additionally, the TDEM profiles suggested that the plume migration followed a preferential flow path. The resistivity range 40–80 Ωm considered as contaminated areas; however, the drilling results showed the close resistivity domain in the depth >70 m below water table for some profiles (BL1, BL2, BL3, BL4 and BL5). The combined results of drilling wells, piezometers, and TDEM apparent resistivity maps showed a coincidence of the migrated leachate plume and water table. Predicted zone of the probable contamination was located at the depth of around 65 m and horizontal offset ranges 0–280 m, 80–240 m, and 40–85 m in the sounding traverses of BL4, BL6 and BL7, respectively.
El-Kaliouby, H. and Abdalla, O., 2015, Application of time-domain electromagnetic method in mapping saltwater intrusion of a coastal alluvial aquifer, North Oman: Journal of Applied Geophysics, v. 115, p. 59-64, doi:10.1016/j.jappgeo.2015.02.003.
Abstract: One-third of the population of Oman depends on the groundwater extracted from the alluvium deposits located along the coast of the Gulf of Oman. However, groundwater depletion and seawater intrusion constitute major challenges along the coastal water accumulations in Oman. The objective of this study is to locate the extent of seawater intrusion and to map the shallow alluvial aquifer in the region, where water accumulates from the rain or the flooding at AlKhod dam. In order to assess the effect of groundwater infiltration, which recharges the aquifer and fights the seawater invasion, a quantitative approach for the groundwater quality and distribution is required to provide reasonable knowledge on the spatial distribution of the aquifers, their thickness and the type of sediments. When groundwater wells and their subsurface geologic and electrical logs are not available or not deep enough, surface geophysical surveys can be considered due to their low cost and short acquisition time. The application of time-domain electromagnetic (TDEM) method in Al-Khod area, Oman has proven to be a successful tool in mapping the fresh/saline water interface and for locating the depth of fresh water aquifer. The depths and inland extents of the saline zone were mapped along three N–S TDEM profiles. The depths to the freshwater table and saline interface calculated from TDEM closely match the available well data.
MartÍnez-Moreno, F.J., Monteiro-Santos, F.A., Madeira, J., Bernardo, I., Soares, A., Esteves, M., and Adāo, F., 2016, Water prospection in volcanic islands by Time Domain Electromagnetic (TDEM) surveying: The case study of the islands of Fogo and Santo Antão in Cape Verde: Journal of Applied Geophysics, v. 134, p. 226-234, doi:10.1016/j.jappgeo.2016.09.020.
Abstract: Water demand in islands, focused in agriculture, domestic use and tourism, is usually supplied by groundwater. Thus the information about groundwater distribution is an important issue in islands water resources management. Time Domain Electromagnetic (TDEM) provides underground resistivity distribution at greater depths and is of easier application than other methods. In this study TDEM technique was used for groundwater prospection in two volcanic islands with water supply problems, the islands of Fogo and Santo Antão in the Republic of Cape Verde. The 10 islands of Cape Verde Archipelago, located off the coast of Senegal (W Africa), present a semi-arid climate and thus suffer from irregular and scarce precipitation. In the Island of Fogo 26 TDEM soundings, presenting an area distribution, were performed on the SW flank of the volcanic edifice. These allowed obtaining a 3D model composed of 5 layers parallel to the topographic surface separated by 50 m depth down to − 250 m. The results indicate the presence of the water-table at a depth of 150 m in the lower ranges of the W flank of the island, and at > 200 m depth in the area above 250 m above sea level (a.s.l.). In the Island of Santo Antão 32 TDEM soundings, distributed along 5 linear profiles, were obtained on the north-eastern half of the island. The profiles are located in two regions exposed to different humidity conditions to the N and S of the main water divide. The northern flank receives the dominant trade winds first and most of the precipitation and, therefore, the water-table is shallower (~ 50 m depth) than in the S (~ 100 m depth). Our study demonstrates the applicability and usefulness of the TDEM method for groundwater prospection in high resistivity contexts such as in volcanic islands.
Bastani, M., Persson, L., Löfroth, H., Smith, C.A. and Schälin D., 2017, Analysis of Ground Geophysical, Airborne TEM, and Geotechnical Data for Mapping Quick Clays in Sweden, in: Thakur, V., L'Heureux, JS. & Locat, A., eds., Landslides in Sensitive Clays: Cham, Switzerland, Springer International Publishing AG, v. 46, p. 463-474, doi:10.1007/978-3-319-56487-6.
Abstract: Airborne transient electromagnetic (ATEM) data for mapping clay areas are acquired in four areas in Sweden. The resistivity models from the inversions of ATEM data are compared to the existing geotechnical, geological and ground geophysical data in one of the areas at Slumpån located in the Göta River valley. The ATEM models reveal information about layering and thickness of the sediments, the river depth and bedrock undulations. The estimated resistivities at the known locations of quick clays are within the range of 8–40 Ωm. The variation is dependent on the type of the surrounding sediments and the leaching process. The resistivity models have a limited resolution and must always be integrated with geotechnical and geological information for a confident and precise interpretation that leads to a realistic model. The method can be utilized as an effective tool prior to planning of any detailed and costly ground geotechnical investigations.
Vignesh, A., Ramanujam, N., Swapan, K.B. and Rasool, Q.A., 2015, Application of Time Domain Electromagnetic (Tdem) Methods for Mapping of Salt Fresh Water Intrusions and Evaluate The Porosity in Carbyn’s Cove, Wandoor and Khurumedhera Beaches in South Andaman: Journal of Coastal Zone Management, v. 18: 413, doi:10.4172/2473-3350.1000413.
Abstract: Time Domain Electromagnetic (TDEM) methods are successfully used to delineate the geometry of different hydrogeological targets to determine porosity of saline and freshwater zones. TDEM can be used to determine both fluid resistivities (ρw) and bulk resistivities (ρ) which are required to calculate the porosity by applying Archie’s equation. By studying saline water intrusion near coastal zone, where ρw and ρ can be determined very accurately by applying TDEM method. From the literature review, it is revealed that the TDEM method is the most suitable geophysical technique for seawater intrusion. TDEM technique is very sensitive to high conductive (low resistivity) zones hence this technique can be applied to study the saltwater intrusion into the fresh water aquifers. Therefore, the aim of the presence study is to find out the porosity of saline water zone for the EM data generated with TDEM technique in the areas of Carbyn’s Cove, Khurumedhera and Wandoor beach of South Andaman The TDEM images shows the range of interface between saline water and fresh water at depth of 4 – 10 m from the shoreline to distance of 20 m in Carbyns cove beach, 7 – 18 m from 10m distance in Wandoor beach and 11 – 17 m from 30 m in Khurumedhera beach, indicating the varying amount of mixing of sea-water throughout the aquifer. The porosity of saltwater and freshwater shows that the low porosity indicates high salinity corresponds to salty brackish water with porous/ sandy or saturated clay and high porosity indicates low salinity corresponds to intermediate quality fresh water zone with Sand/gravel or minor clay. It is reasonably presumed from present field study, a close correspondence between the high resistivity zones that encompass with lower total dissolved solids concentration (fresh water) and lower resistivity region was incorporated with the higher amount of total dissolved solids concentration. TDEM soundings with Central Loop Technique appear to be a suitable tool to demarcate the transition zones between fresh water and salt water.
References
Auken, E., 1995, 1D Time Domain Electromagnetic Interpretations Over 2D/3D Structures: Symposium on the Application of Geophysics to Engineering and Environmental Problems, Abstracts, p. 329-337, doi:10.4133/1.2922152.
Baawaain, M.S., Al-Futaisi, A.M., Ebrahimi, A. and Omidvarborna, H., 2018, Characterizing leachate contamination in a landfill site using Time Domain Electromagnetic (TDEM) imaging: Journal of Applied Geophysics, v. 151, p. 73-81, doi:10.1016/j.jappgeo.2018.02.002.
Bastani, M., Persson, L., Löfroth, H., Smith, C.A. and Schälin D., 2017, Analysis of Ground Geophysical, Airborne TEM, and Geotechnical Data for Mapping Quick Clays in Sweden, in: Thakur, V., L'Heureux, JS. & Locat, A., eds., Landslides in Sensitive Clays: Cham, Switzerland, Springer International Publishing AG, v. 46, p. 463-474, doi:10.1007/978-3-319-56487-6.
El-Kaliouby, H. and Abdalla, O., 2015, Application of time-domain electromagnetic method in mapping saltwater intrusion of a coastal alluvial aquifer, North Oman: Journal of Applied Geophysics, v. 115, p. 59-64, doi:10.1016/j.jappgeo.2015.02.003.
Fitterman, D.V. and Anderson, W.L., 1987, Effect of transmitter turn-off time on transient soundings: Geoexploration, v. 24:2, p. 131-146, doi:10.1016/0016-7142(87)90087-1.
MartÍnez-Moreno, F.J., Monteiro-Santos, F.A., Madeira, J., Bernardo, I., Soares, A., Esteves, M. and Adāo, F., 2016, Water prospection in volcanic islands by Time Domain Electromagnetic (TDEM) surveying: The case study of the islands of Fogo and Santo Antão in Cape Verde: Journal of Applied Geophysics, v. 134, p. 226-234, doi:10.1016/j.jappgeo.2016.09.020.
Nabighian, M.N., 1979, Quasi-static transient response of a conducting half-space—An approximate representation: Geophysics, v. 44, no.10, p. 1700-1705, doi:10.1190/1.1440931.
Vignesh, A., Ramanujam, N., Swapan, K.B. and Rasool, Q.A., 2015, Application of Time Domain Electromagnetic (Tdem) Methods for Mapping of Salt Fresh Water Intrusions and Evaluate The Porosity in Carbyn’s Cove, Wandoor and Khurumedhera Beaches in South Andaman: Journal of Coastal Zone Management, v. 18: 413, doi:10.4172/2473-3350.1000413.
