National Highlight - Comparing Natural Lakes and Manmade Reservoirs
The statistical survey design includes both natural lakes and manmade reservoirs. The national and ecoregional results include data from both of these groups together. This highlight separates the data from lakes and reservoirs and explores the similarities and differences between these subpopulations.
Background

Population
Based on the NLA 2012, of the total 111,119 lakes assessed, approximately 52% (58,700) were natural and 48% (53,119) were manmade. The NLA found that natural lakes are distributed fairly evenly in size from small to large while most manmade reservoirs are relatively small. For example, 40% of reservoirs are less than 10 acres (4 hectares) compared to 22% of lakes.
Distribution
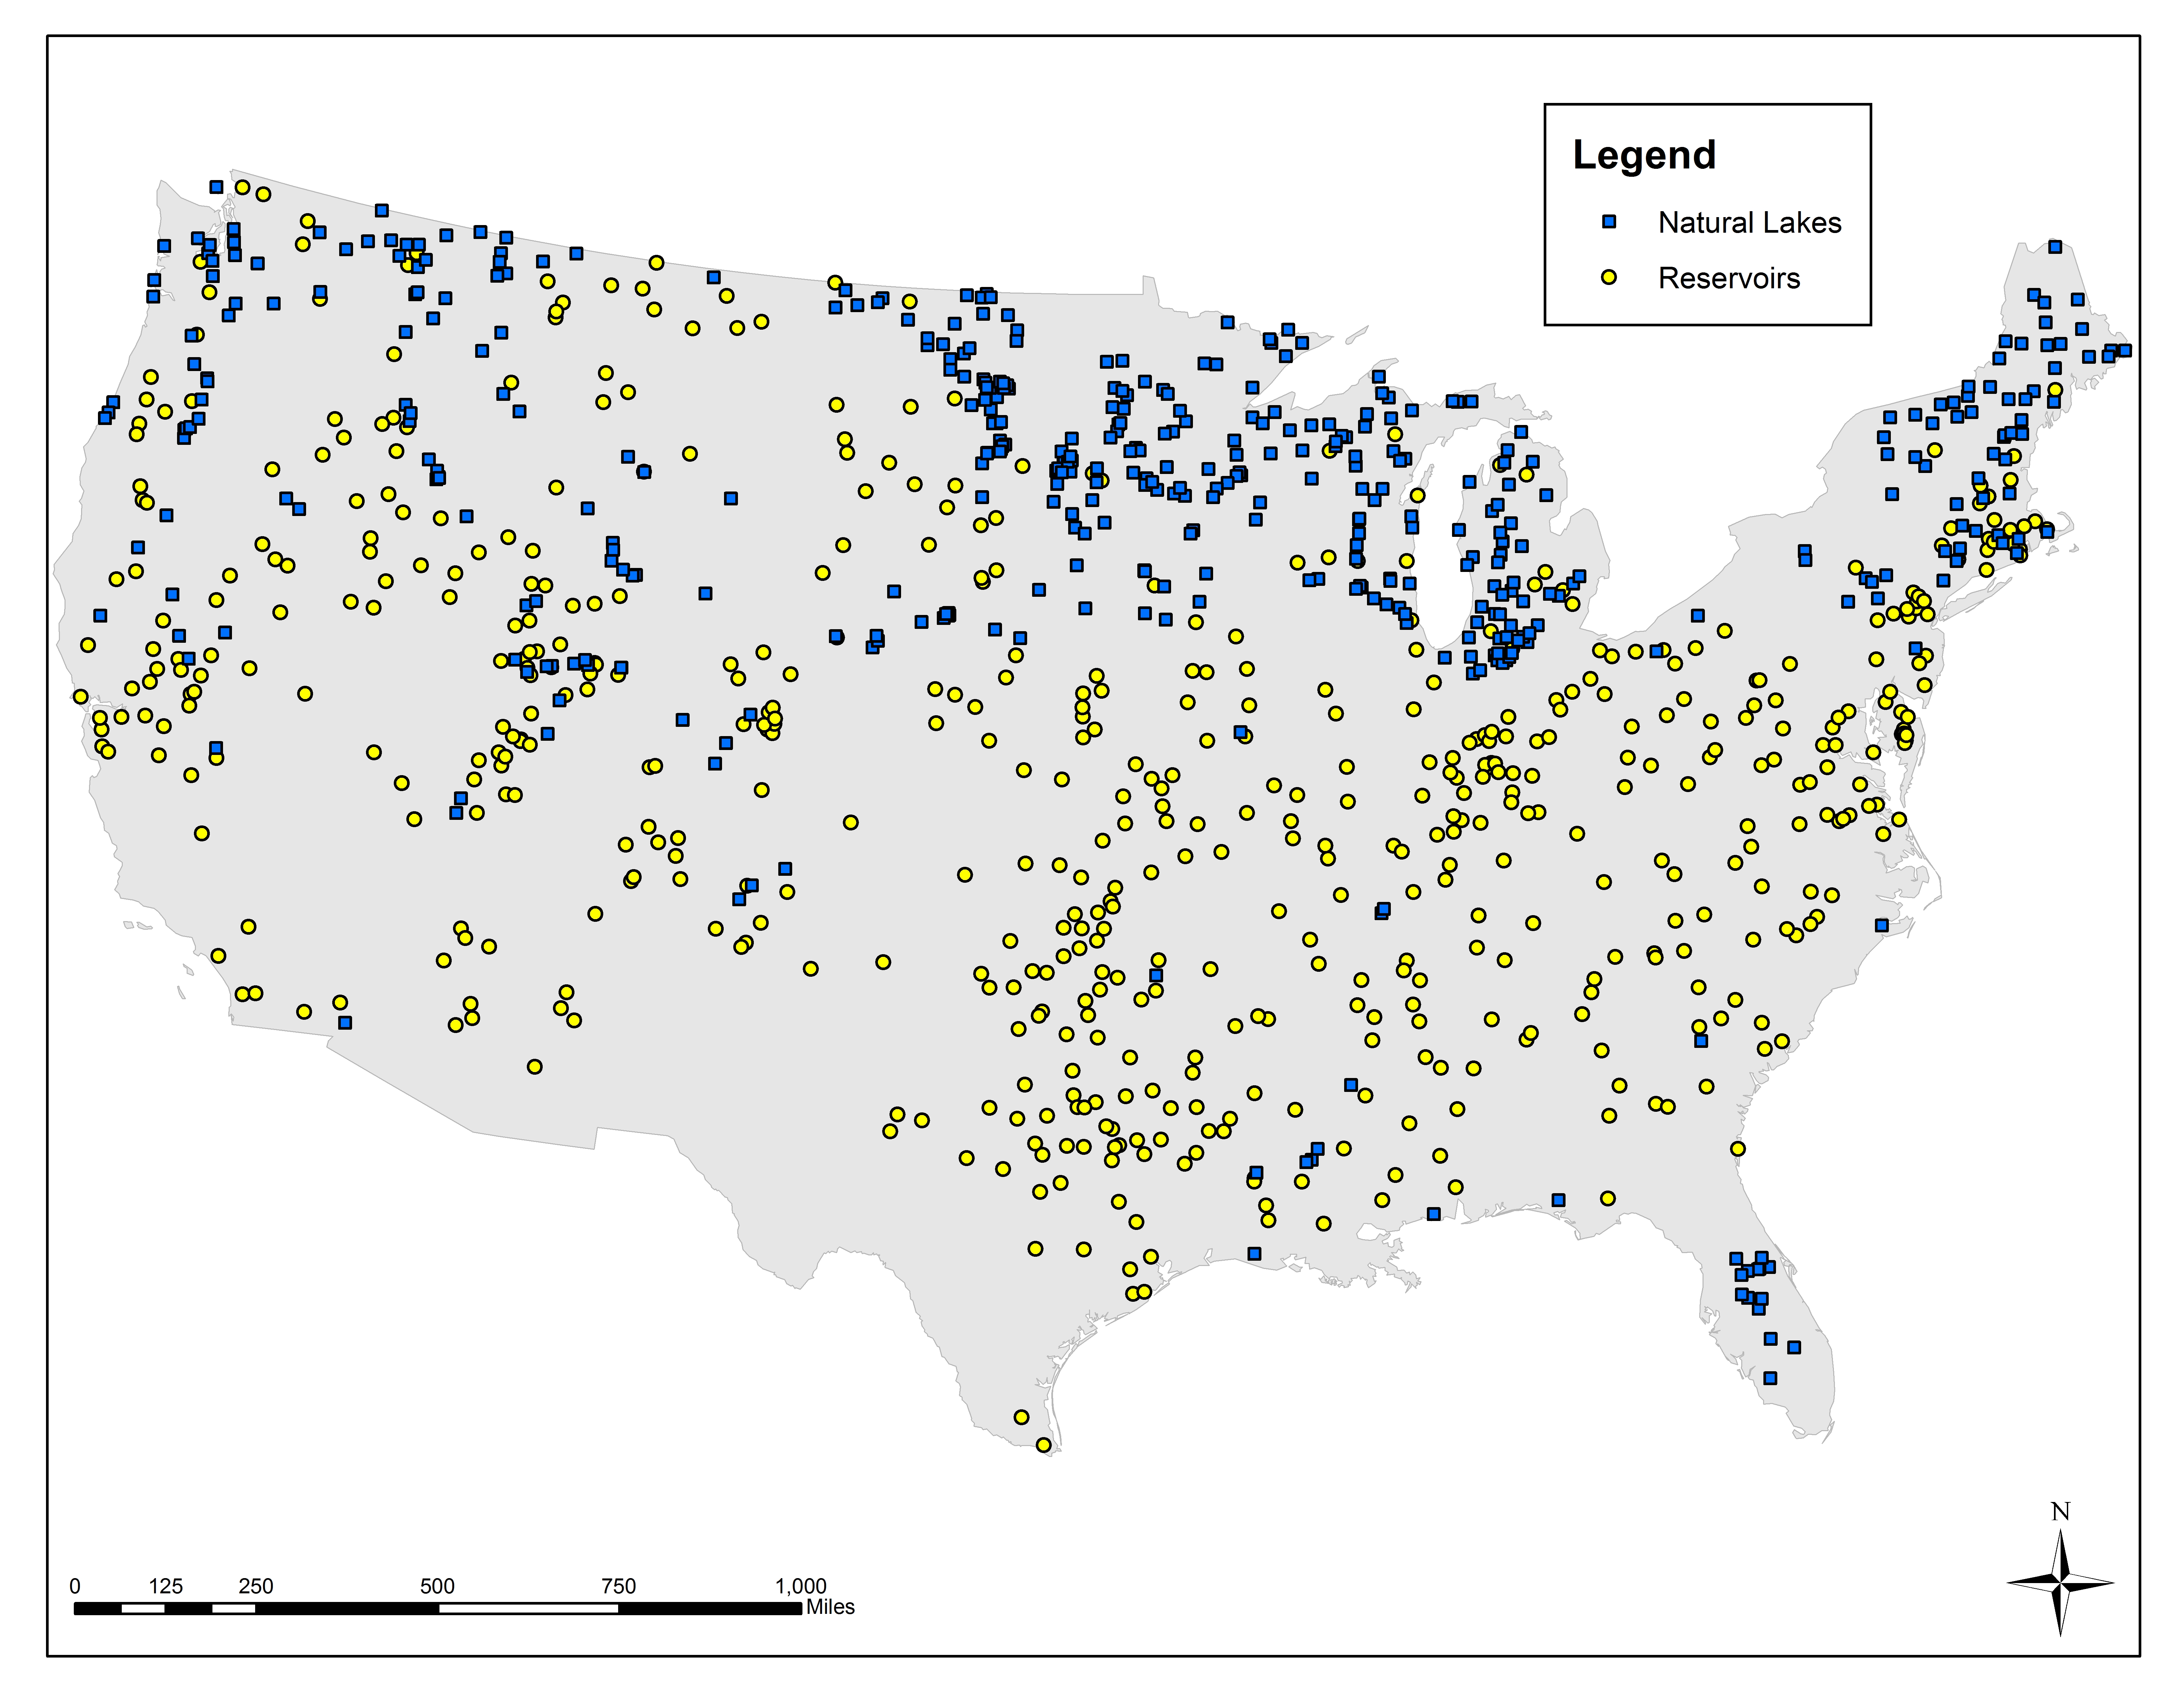
Reservoirs occur throughout the United States, however, most natural lakes are concentrated in five ecoregions: the Upper Midwest, Northern Appalachians, Temperate Plains, Coastal Plains, and the Western Mountains. See the map below for the geographic distribution of natural lakes and manmade reservoirs sampled for the NLA in 2012.
Key Differences
The NLA assessed both lakes and reservoirs using the same set of protocols and analytical procedures. While one might expect to see differences in the condition of these systems given their difference in origin, the NLA identified only six indicators that showed statistically significant differences at the national level – zooplankton, total phosphorus, lakeshore disturbance, chlorophyll a risk, total mercury in sediment, and methylmercury in sediment.
Assessment of four of these indicators (discussed below):
- zooplankton
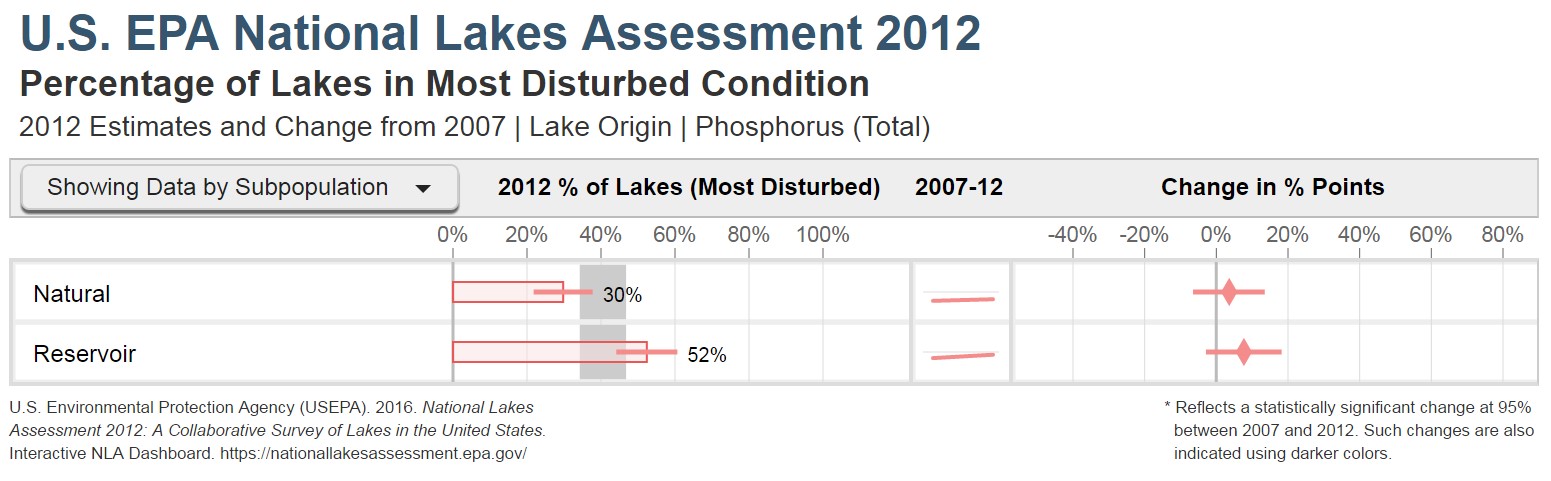
- total phosphorus
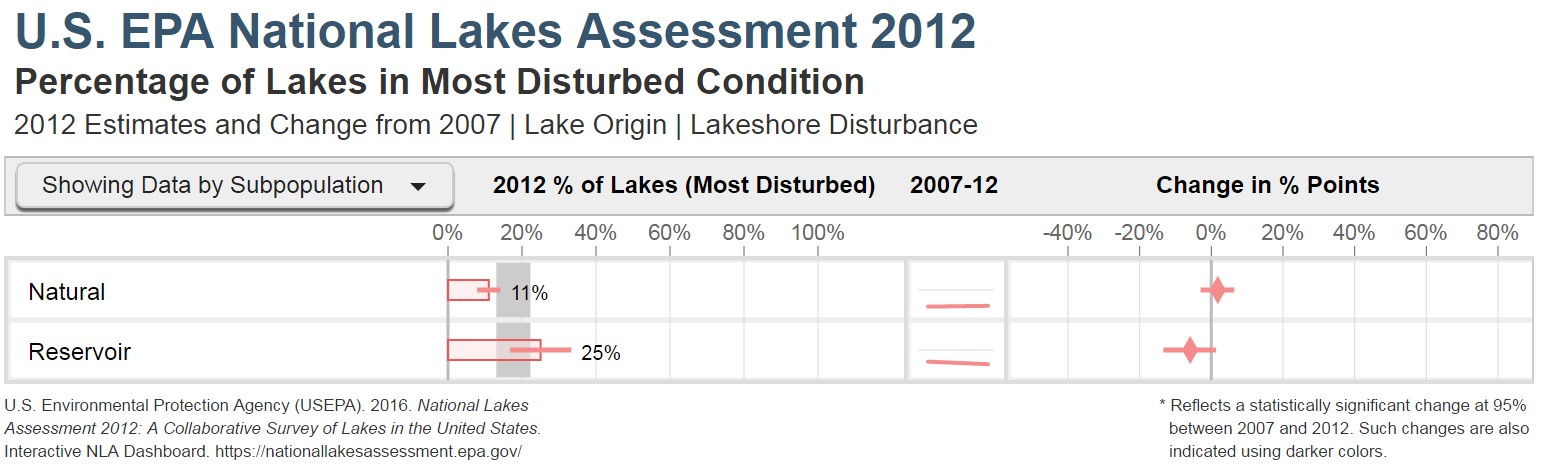
- lakeshore disturbance, and
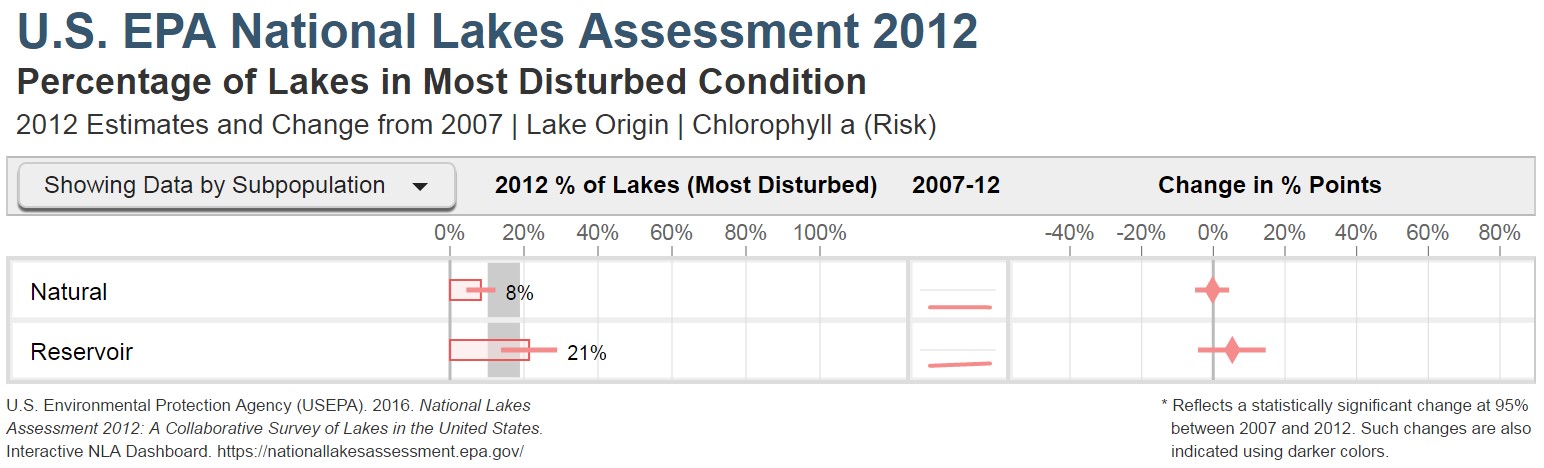
- chlorophyll a risk
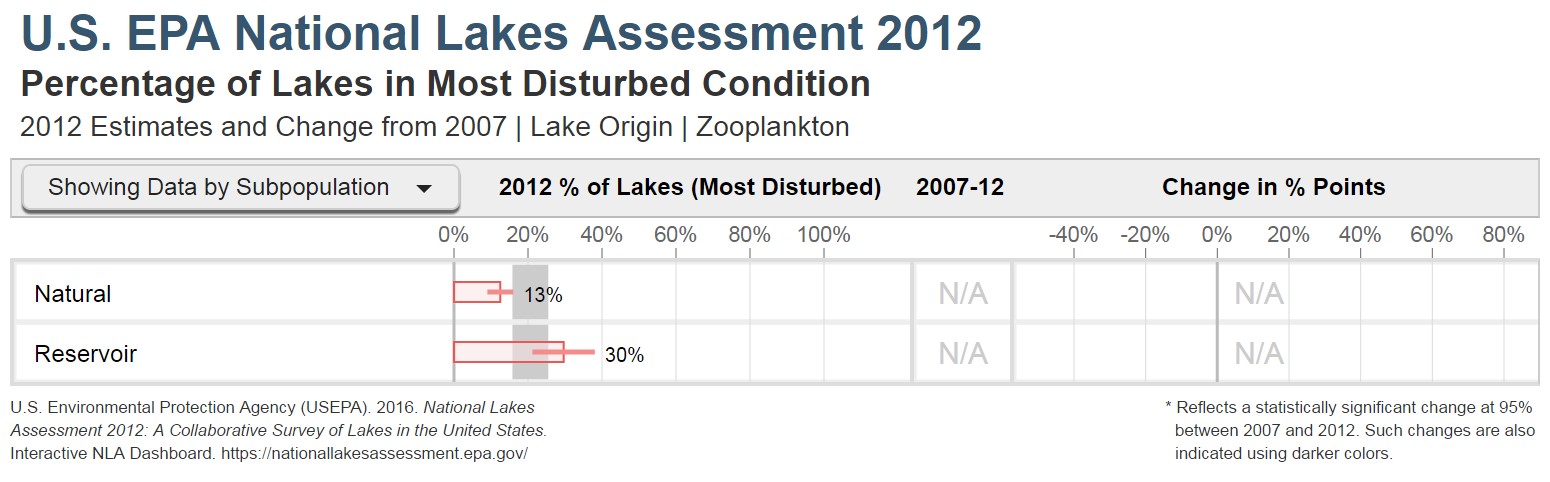
showed that a higher percentage of reservoirs were in the most disturbed category compared to lakes.
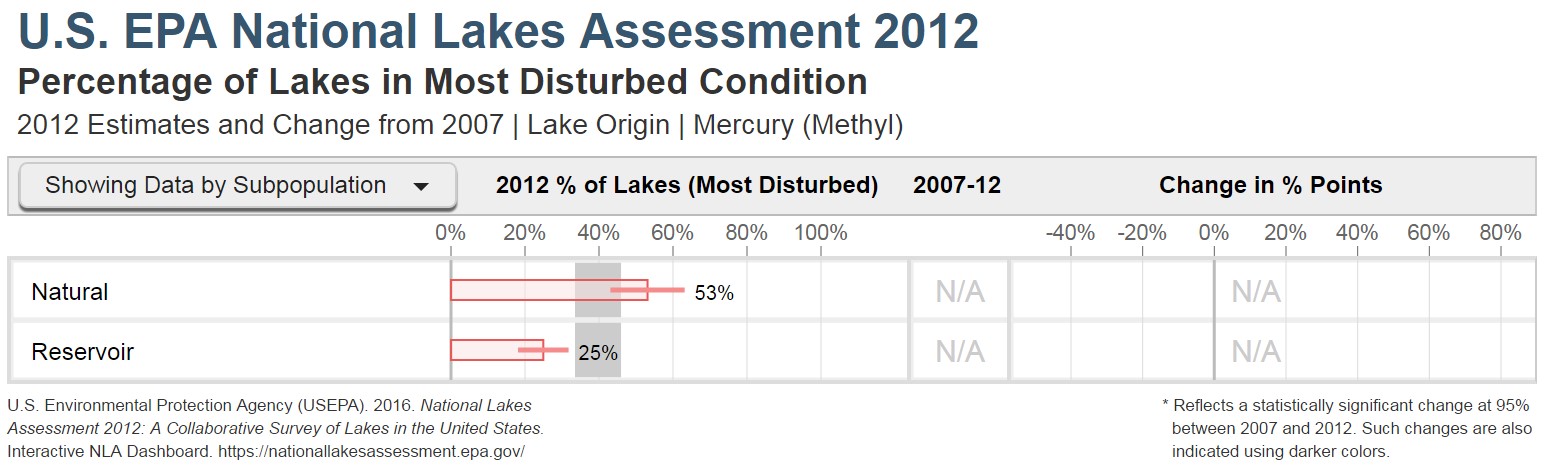
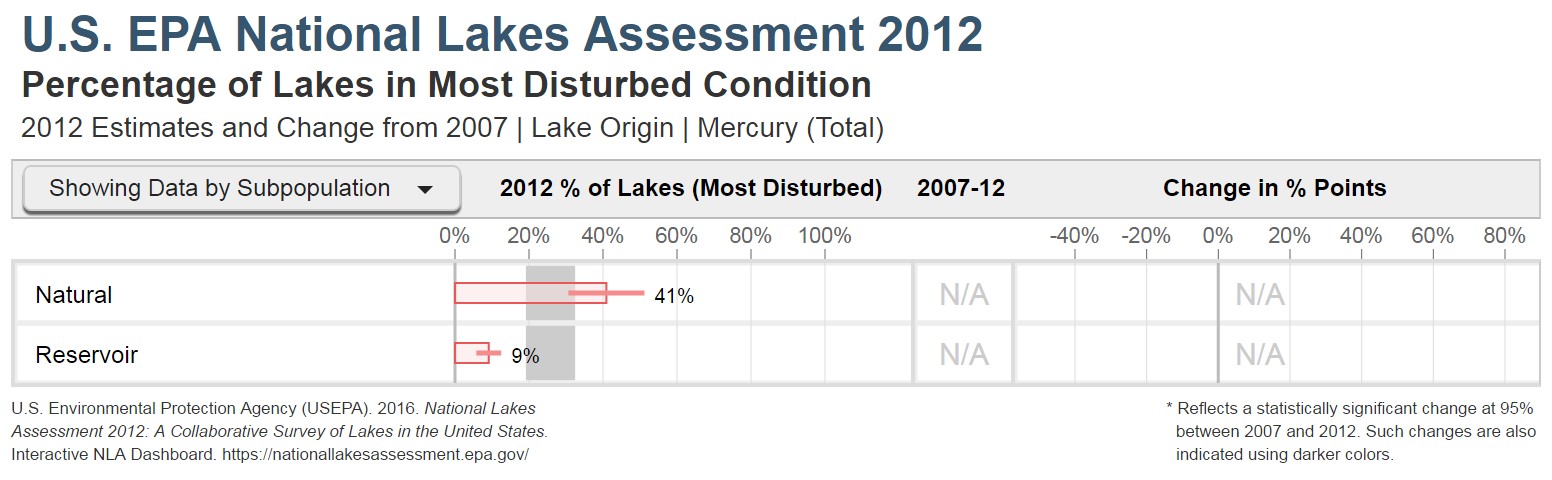
Conversely, more lakes were in the most disturbed category compared to reservoirs for both total mercury and methylmercury levels (also discussed below).
Below are graphics that show the percentages of natural lakes and manmade reservoirs that were in the most disturbed condition category for each of these indicators. For information on the percentages of lakes and reservoirs that were in the least disturbed and moderately disturbed condition categories, see the Interactive NLA Dashboard. See the dashboard help guide for information on how to interpret the lake condition graphics.
Zooplankton
Total Phosphorus
Lakeshore Disturbance
Chlorophyll a Risk
Total Mercury
Methylmercury