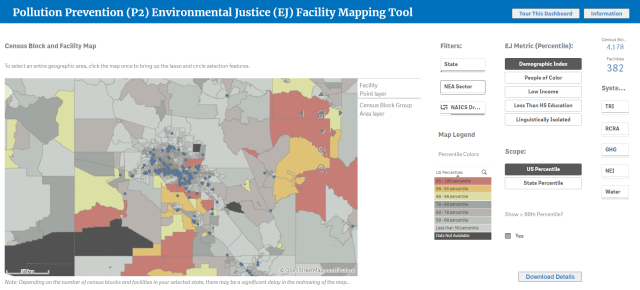
P2 EJ Facility Mapping Tool
On this page:
- New Facility Mapping Tool
- What Can the Tool Do?
- Key Features
- Elements of P2 EJ Facility Mapping Tool
- Resources
On other pages:
- Pollution Prevention Grants Overview
- P2 Grant Funding Opportunities
- P2 National Emphasis Areas
- Grant Reporting
- Grant Results
- Grant Summaries
- Past Funding Opportunities
New Facility Mapping Tool
To support the Agency’s environmental justice (EJ) goals, as well as the Justice40 Initiative in pollution prevention (P2) grant work, EPA developed a mapping tool that allows users to identify industrial facilities located in or adjacent to communities with EJ concerns.
What Can the Tool Do?
The P2 EJ Facility Mapping Tool helps prospective P2 grant applicants, grantees and interested stakeholders geographically target facilities in or adjacent to underserved communities within the framework of the P2 program’s five industrial sector-based National Emphasis Areas (NEAs). The tool allows users to identify industrial facilities that may be contributing to pollution levels in a selected area, including communities with environmental justice (EJ) concerns.
Grants awarded under the FY 2022 and FY 2023 grant cycles will provide beneficial P2 practices to businesses receiving technical assistance (information, training and tools). The grants will help those businesses reduce pollution from air, water and land affecting all communities, but will especially address pollution concerns disproportionately impacting overburdened and vulnerable communities.
Click here for more information on P2 grant programs.
Key Features
- Allows users to identify underserved communities that may have EJ concerns based on a demographic index.
- Allows users to access facilities included in Toxic Release Inventory (TRI), Resource Conservation and Recovery Act (RCRA) and other data sets.
- Allows users to filter data based by industrial sector including by National Emphasis Areas (NEAs).
- Contains a “tour” button to help users understand how to use key features of the tool.
Elements of P2 EJ Facility Mapping Tool
- Five environmental datasets
- Includes data from the Toxics Release Inventory, hazardous waste shipment manifests, the Greenhouse Gas Reporting Program, the Emissions Inventory System, and water discharge monitoring reports.
- Six demographic indicators
- Users can customize the demographics displayed on the map by selecting from the metrics listed below or a demographic index that combines multiple metrics.
- People of Color: Individuals who list their racial status as a race other than white alone and/or list their ethnicity as Hispanic or Latino.
- Low Income: Individuals in households where the household income is less than or equal to twice the federal poverty level.
- Less Than HS Education: Individuals aged 25 and over with less than a high school (HS) degree.
- Linguistically Isolated: Households in which no one age 14 and over speaks English "very well" or speaks English only (as a fraction of households).
- Unemployment Rate: Number of unemployed people as a percentage of the labor force.
- Low Life Expectancy: Life expectancy represents the average number of years that a group of infants would live if the group was to experience, throughout life, the age-specific death rates present in the year of birth.
- Users can customize the demographics displayed on the map by selecting from the metrics listed below or a demographic index that combines multiple metrics.
*Note: A block group is an area defined by the U.S. Census Bureau that usually encompasses a range of 600-3,000 people living in it. The U.S. is divided into more than 200,000 block groups.

