Fish and Salinity in the San Francisco Estuary
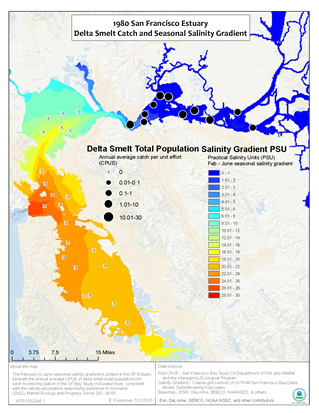
EPA created maps for six fish species that show changes in abundance and distribution as they relate to seasonal changes in the salinity gradient over a 33-year time period. The maps visualize established salinity-abundance relationships and show how distribution has changed over time in the San Francisco Bay Delta Estuary.

The seasonal salinity gradient was simulated by the coarse-grid version of the UnTRIM San Francisco Bay-Delta Model and fish monitoring data are from the San Francisco Bay Study.
The maps show that the abundance of a number of fish species is higher when the low salinity zone is within or westward of Suisun Bay consistent with established science.
This work was published in the journal San Francisco Estuary and Watershed Science (July 2016), “3-D Simulations of the San Francisco Estuary with Subgrid Bathymetry to Explore Long-Term Trends in Salinity Distribution and Fish Abundance.”
- San Francisco Estuary Delta Smelt Catch and Seasonal Salinity Gradient (pdf)
- San Francisco Estuary Juvenile Longfin Smelt Catch and Seasonal Salinity Gradient (pdf)
- San Francisco Estuary Longfin Smelt Catch and Seasonal Salinity Gradient (pdf)
- San Francisco Estuary Pacific Herring Catch and Seasonal Salinity Gradient (pdf)
- San Francisco Estuary Sacramento Splittail Catch and Seasonal Salinity Gradient (pdf)
- San Francisco Estuary Starry Flounder Catch and Seasonal Salinity Gradient (pdf)
- San Francisco Estuary Striped Bass Catch and Seasonal Salinity Gradient (pdf)
