CMAQ 25th Anniversary
In 2023 we celebrated the 25th anniversary of the first CMAQ public release on June 30, 1998 by looking back at major milestones in CMAQ science with #CMAQ25th.
Environmental Managers Magazine Commemorates 25th Anniversary of CMAQ
The January 2024 issue of the Air & Waste Management Association's EM Magazine for environmental managers commemorates the 25th anniversary of the initial release of CMAQ. The issue of EM highlights “the value of modeling communities to strengthen atmospheric science” using the lens of the CMAQ community.
EPA's Science Matters Newsletter Series on CMAQ's 25th Anniversary
- Read about what has made the CMAQ model so successful over the years and why it is still relevant today.
- Read about how CMAQ has been working toward a “one environment–one health” approach throughout its lifetime.
- Read about how CMAQ has continued to innovate, modernize, and address emerging environmental issues.
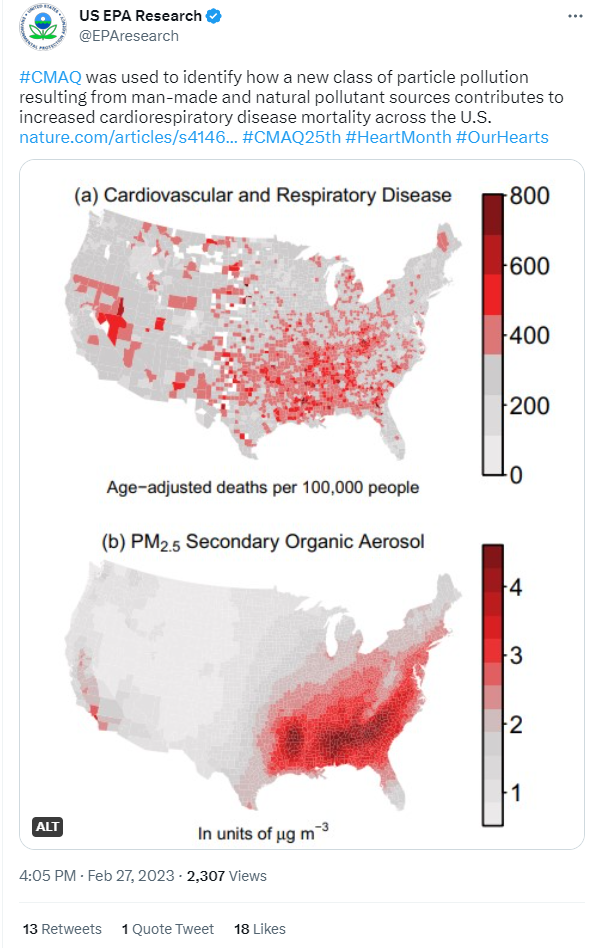
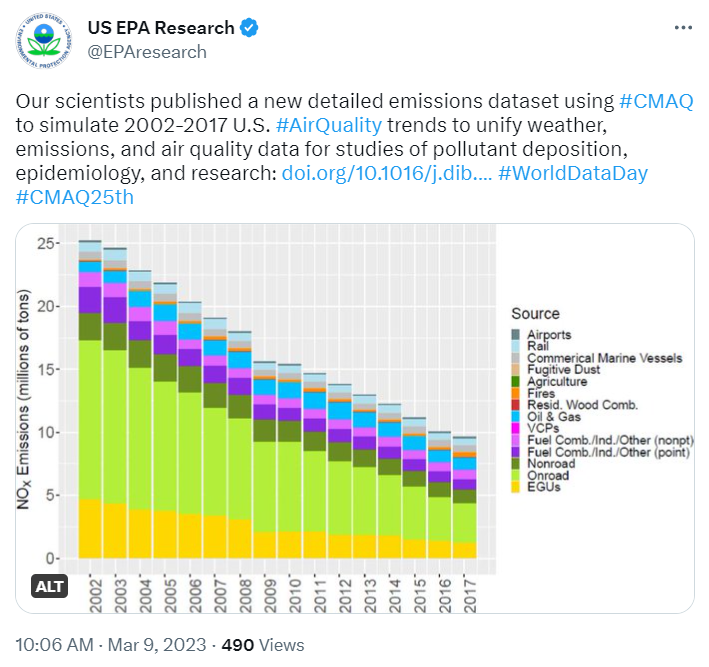
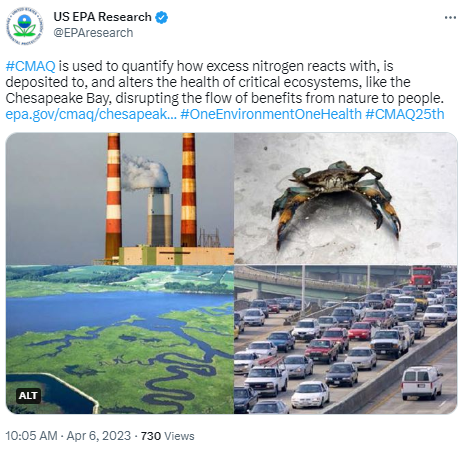
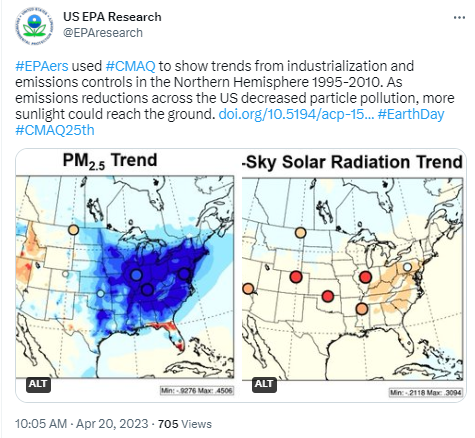
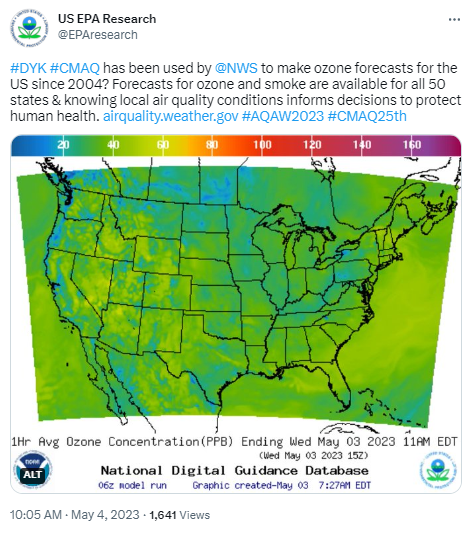
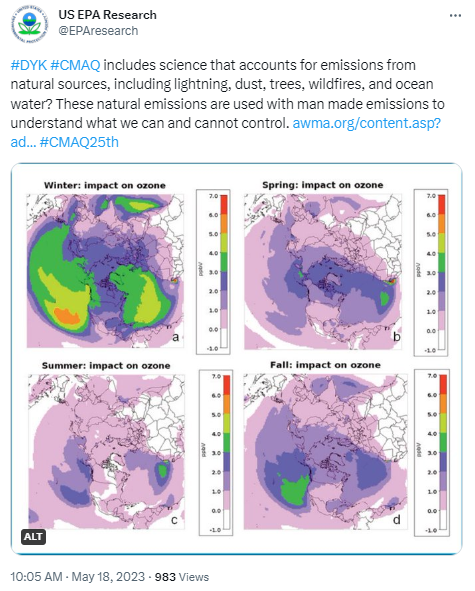
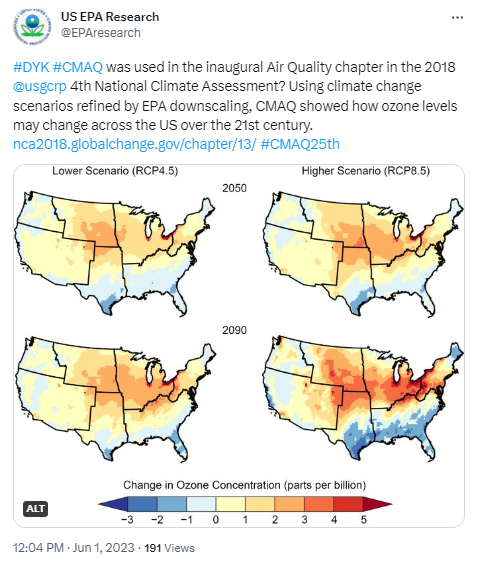
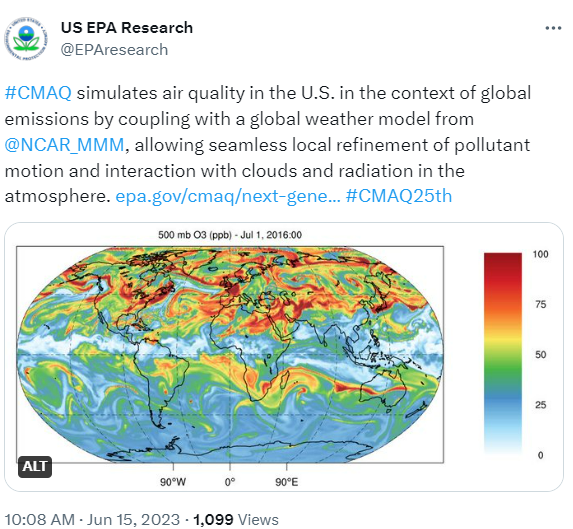
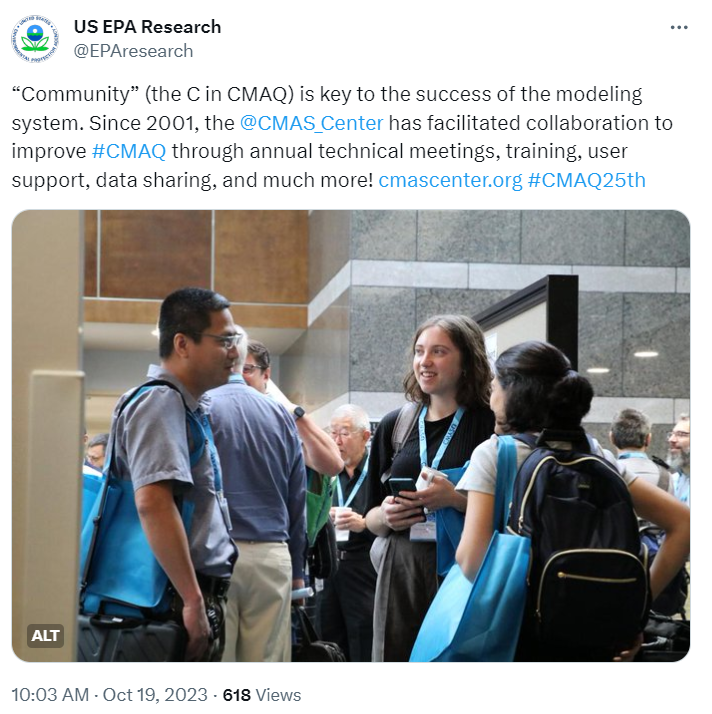
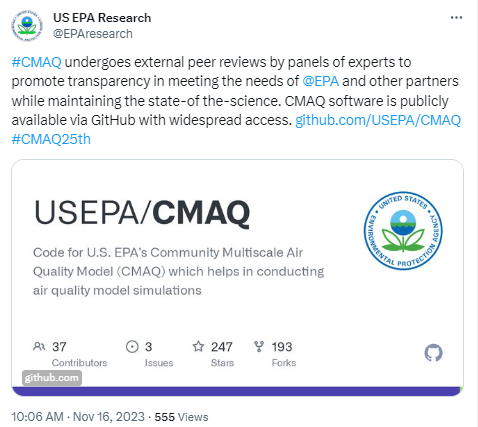
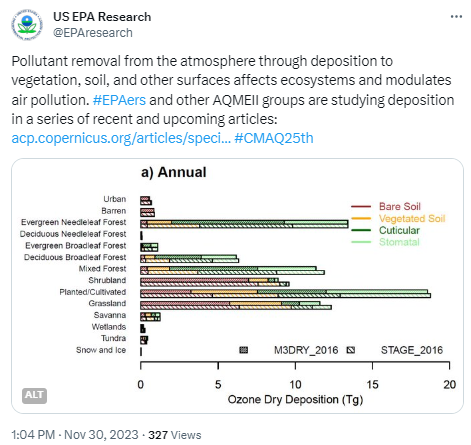
Celebrating CMAQ's 25th Anniversary with 25 Posts on X in 2023