About EcoDIVER
Basic Information
EcoDIVER (Ecological Database and Interactive Visualizations of Evidence Records) is an online data portal that allows users to access and interact with evidence pulled from the scientific literature. EcoDIVER is organized by project, with each project presenting a collection of evidence, extracted from the published scientific literature, that addresses a specific topic or question. Within each project, EcoDIVER users are able to:
- Explore the evidence by geographic location, ecoregion, or other criteria;
- View summary evidence visualizations;
- Dive into these visualizations to examine individual pieces of evidence; and
- Filter evidence to focus on findings most relevant to them.
Data and Visualizations
Data Used in EcoDIVER
The evidence records in EcoDIVER include several kinds of data extracted from the published scientific literature or gray literature (e.g., reports from state agencies, dissertations) that addresses a specific topic or question. These data include information about the citation (e.g., authors, year of publication, and additional details found in EPA's Health and Environmental Research Online [HERO] database), dataset and study design, data analysis and results, contextual variables, and study quality. Refer to this help file for details about the variables included in these categories of literature-based data.
Effect sizes are important for analyzing results from multiple studies that reported the direction and magnitude of stressor-responses relationships with comparable statistical measures. For example, Pearson correlation coefficients (Pearson's r) are commonly reported by studies to show the direction and magnitude of stressor-response relationships. Several other statistics (e.g., Spearman correlation coefficients, r-squared values) can be converted to Pearson's r to increase the number of studies in the evidence base for a particular question. Other examples of effect sizes include odds ratios, response ratios, and mean differences. Many of the visualizations in EcoDIVER are used to compare effect sizes from different studies, locations, or endpoints.
Visualizations Used in EcoDIVER
To explore how much evidence exists in various categories

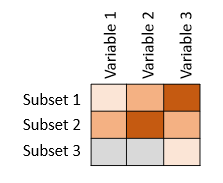
A heat map is a data visualization tool that can be used to graphically represent data. Heat maps are like tables or spreadsheets, but data in each cell are represented by colors instead of numbers. The color of each cell corresponds to the magnitude of the cell amount. In the Stream Nutrients Project, the rows are measures of biological response (e.g., benthic chlorophyll a concentration, diatom biovolume, macroinvertebrate richness) and the columns are nutrient stressors (e.g., total phosphorus, nitrate, soluble reactive phosphorus). Darker colors indicate more evidence records are available in the database. Heat maps can be helpful for summarizing and understanding the body of evidence and potential knowledge gaps.

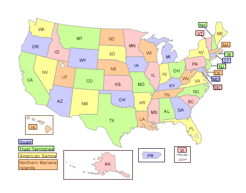
Geographic maps can be used to visualize data in different ways. For example, geographic maps in EcoDIVER summarize the number of evidence records, similar to a heat map, but with site information included in the graphic. The color of each state or country corresponds to the number of evidence records that are available in the database. When you mouseover a state or country, you can quickly see details such as the number of citations with data from that specific location in the database. When you click on the location, additional information appear below the map including the authors and years of the citations, the number of effect sizes from each citation, and links to bibliographic information in HERO.
To explore the distribution and central tendency of evidence
There are several visualization types in EcoDIVER from which you can learn about the range and central tendency of evidence.
A box plot can be particularly useful for comparing the distributions of different subsets of a single variable. In EcoDIVER, a modified version of a box plot provides summary statistics of effect sizes (in the case of the Stream Nutrients Project, the effect size is Pearson's r) associated with subsets based on specific stressor-response relationships, shown as horizontal gray boxes with bars on each side. The width of the solid gray box represents the 95% confidence interval of effect sizes. If this interval does not overlap the vertical zero line, the stressor-response relationship is consistently non-zero (i.e., indicates a significantly positive correlation) across multiple studies.

Gray lines indicate the minimum and maximum Pearson's r for each relationship; mean and median effects sizes are indicated by a red dot and a red line, respectively. When you mouseover one of these plots, the values of the summary statistics appear. The left side of the plots have a table of the stressor-response relationships and sample sizes. By clicking on the sample sizes, you can see a list of studies included in each stressor-response relationship.

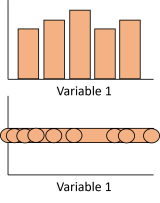
A bar chart in EcoDIVER shows the frequency of evidence records in the database across effect size values. Linear distribution plots show the range of stressor measures (e.g., total phosphorus concentrations), or environmental context variables (e.g., watershed area). There are separate linear distribution plots for the minimum, mean, and maximum values of stressors or environmental context variables because the underlying data in EcoDIVER are statistics extracted from multiple studies in the literature, rather than statistics derived from re-examining raw data.
To compare evidence from individual studies

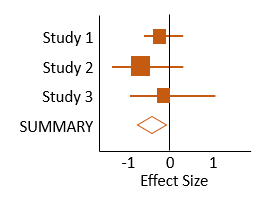
Forest plots are used to visualize meta-analytical results of multiple scientific studies. A basic forest plot may include a list of individual citations or studies included in the meta-analysis on one side. Next to this list are points or bars indicating effect size statistics (e.g., effect size mean, variance, weight). There are various methods of weighting effect sizes, such as by sample size or study quality. Weights of individual effect sizes factor into calculating a summary effect size, usually shown as a symbol at the top or bottom of forest plots. This summary effect size is usually a diamond or other shape that differentiates it from the individual study effect sizes. There are many variations of forest plots, such as thick forest plots and rainforest plots. Forest plots are useful for comparing effect sizes from multiple studies and visualizing the weights of individual study effect sizes contributing to the summary effect size.
Using EcoDIVER
EcoDIVER users should begin by selecting a project of interest on the EcoDIVER homepage. For each project, users can read background information about the topic and a general description of the scope of evidence within the project. Then, users may select their entry point to visualize and interact with the evidence. Visualization options include heat maps, geographic maps, forest plots, and linear distribution plots (see Data and Visualizations section above). Each type of visualization includes information about how to navigate its features through instructional text and/or “tool tips” that appear when a mouse is rolled over a specific area.
Notably, each type of visualization includes: (1) filters so that users can select relevant evidence based on a variety of characteristics (e.g., geography) and (2) links to the bibliographic details of the sources from which evidence was drawn. Every entry point opens a new tab in the browser, so users can easily come back to the project page when ready to view and interact with evidence in a different way. For most projects, there is also an option to download a spreadsheet of evidence directly to a user’s desktop for closer examination. To select a new project, users should return to the EcoDIVER homepage.
Learn more about using EcoDIVER from the Stream Nutrients Visualization Guide.
EcoDIVER is a dynamic resource. New projects will be added as they become available. The evidence within individual projects may or may not be updated over time, depending on the original purpose of the project. For the availability or update status of projects, please see the Contact Us page.
DISCLAIMER: EcoDIVER does not constitute U.S. Environmental Protection Agency policy. Mention of trade names or commercial products does not constitute endorsement or recommendation for use.
