Redevelopment Economics at RCRA Corrective Action Facilities
On this page:
Overview
Facilities cleaned up under the Resource Conservation and Recovery Act (RCRA) Corrective Action program contribute numerous benefits to their communities. Cleanups performed under the RCRA Corrective Action program can set the stage for continued use or a wide range of new developments – vibrant neighborhoods, shopping centers, office buildings, hotels, restaurants, or other uses. Corrective Action cleanups also allow on-site businesses to continue operating while protecting human health and the environment. Cleanup facilitates continued operation of on-site manufacturers, chemical plants, waste handlers and other vital industrial and commercial uses.

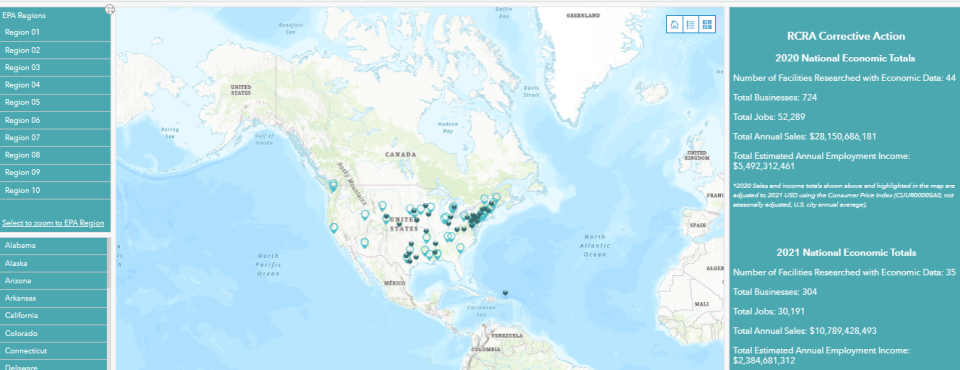
EPA began collecting economic information for RCRA Correction Action facilities in 2020. From 2020-2021, cumulatively, EPA collected economic data for a total of 79 RCRA Correction Action facilities. Together, those 79 facilities support 1,028 businesses, which employ over 82,000 people with aggregated, estimated annual (inflation-adjusted) income of nearly $8 billion and cumulative (inflation-adjusted) sales of $39 billion. Since this analysis is from a small subset of the nearly 4,000 facilities being cleaned up, the benefits associated with all RCRA Corrective Action cleanups are likely much greater. You can find a breakdown of these benefits by year studied in the table below.
Additionally, Corrective Action cleanups are an important part of EPA’s focus on environmental justice to help correct disparities in access to a clean and safe environment. EPA found that approximately 25% of the facilities in this study are located within communities with potential environmental justice concerns. More than 170 businesses are operating at these facilities, helping to generate 7,900 jobs and more than $522 million in annual income for these communities.
| Summary of RCRA Corrective Action Economic Information (2020-2021), Selected Facilities | |||||
|---|---|---|---|---|---|
| Year Studied | Number of Facilities Researched with Economic Dataa |
Number of Businesses |
Number of Jobs | Adjusted Annual Sales b |
Adjusted Annual Employment Incomeb |
| 2020 | 44 | 724 | 52,289 | $28.2 billion | $5.5 billion |
| 2021 | 35 | 304 | 30,191 | $10.8 billion | $2.4 billion |
| Totals | 79 | 1,028 | 82,480 | $39 billion | $7.9 billion |
|
Notes: |
|||||
Some benefits associated with facility cleanup and reuse are easy to quantify. For example, commercial or industrial reuse of sites can bolster local economies by supporting jobs and generating sales revenue. However, not all sites in reuse involve an on-site business or other land use that employs people. Many sites have beneficial effects that are not easily quantified, such as properties providing ecological or recreational benefits (e.g., parks, wetlands, ecological habitat, open space). In addition, sites can support continued and new residential use for which the associated economic benefits may not be fully captured by site business data alone. Economic information is not available for all sites in reuse.
Economic Profiles
EPA developed a series of facility profiles to describe the reuses and continued uses happening across the country at facilities cleaned up under the RCRA Corrective Action program. These two-page profiles highlight the sites’ economic vitality and other positive impacts for their communities.
Economic Methodology
EPA obtains economic data for facilities in reuse or continued use from reputable sources. Information on the number of employees and sales volume for on-site businesses typically comes from the Hoovers/Dun & Bradstreet (D&B) database. When Hoovers/D&B database research is not able to identify employment and sales information for on-site businesses, EPA uses the Reference Solutions and Manta databases. These databases include data reported by businesses. Accordingly, some reported values might be underestimates or overestimates. In some instances, business and employment information come from publications such as company annual reports, business websites, and news media reports. Employee income is estimated using average wages from the Bureau of Labor Statistics for the specific industries at each site. In cases where there is uncertainty, EPA presents lower-end estimates to avoid overstating economic impacts. While some sites may cover large areas, if they support primarily residential use, or other uses that do not employ people or generate sales revenue, the site-related economic totals may appear lower than expected.
For more information about economic research methodology, read through the Summary of 2021 RCRA Corrective Action Economic Benefits Study and Research Methodology (pdf) .
Related Studies
The economic benefits from RCRA Corrective Action cleanups go beyond those associated with on-site businesses. According to recent research, EPA’s Corrective Action program contributed to a $323 million increase in the value of homes near the 195 completed cleanups studied. By identifying and completing the cleanup of contamination, homeowners near the cleanups experience an average of a six to seven percent increase in the value of their homes. Another recent study notes that housing price increases are largest for lower-cost homes.
Learn more about these other studies below:
- Hazardous Waste and Home Values: An Analysis of Treatment and Disposal Sites in the U.S.
- Impacts of Hazardous Waste Cleanups on Housing Prices and Neighborhood Change


