Overview of the 2020 CDR National Review
A total of 5,237 sites reported data on 8,649 chemicals for the 2020 CDR reporting cycle. These sites are located across the U.S., including U.S. territories such as Puerto Rico. The data submitted for the 2020 CDR reporting cycle were compared to the data reported for the previous two CDR reporting cycles to identify trends from 2010 through 2019.
Interactive Map of CDR Sites
Use the interactive map to identify sites in a community that reported CDR data for the 2020 CDR reporting cycle. Most reporting sites have manufacturing and import activities occurring on-site; however, a small portion, 5.5% (or 289 sites), reported that all their reported chemicals are entirely imported and never physically at the reporting site. Click on CDR sites (purple dots) to view details about the site.
Click on any one of the locations on the map to see detailed information.
View Larger Map
Chemical Groupings
For this National Review, CDR data were analyzed as three general chemical groups identified by EPA's Office of Pollution Prevention and Toxics (OPPT). These groups are: All Chemicals; TSCA Risk Evaluation Chemicals; and per- and polyfluoroalkyl substances (PFAS).
The chemical grouping for "All Chemicals" refers to any CDR chemical submission. The group "TSCA Risk Evaluation Chemicals" means existing chemicals that have undergone risk evaluation by OPPT since 2016 or were undergoing risk evaluation as of December 2022. As a category, TSCA Risk Evaluation Chemicals comprise 33 chemicals [or 37 chemicals by Chemical Abstracts Service Registry Number (CASRN) 1 (see full TSCA Risk Evaluation Chemical list)].
PFAS are widely used chemicals. The many fluorine atoms contained in PFAS greatly reduce the rates at which these chemicals are metabolized and breakdown in the environment. As a class of chemicals, PFAS tend to persist in the environment.
The term "PFAS" is used broadly by many organizations for their individual research or programmatic needs. For the 2020 CDR National Review, EPA identified PFAS using OPPT's structural definition of a PFAS. Note that OPPT's structural definition for identifying PFAS may differ from other EPA offices or programs, or other organizations outside of EPA (see other PFAS lists at the CompTox Chemical Dashboard PFAS Master List of PFAS Substances). More information on EPA's actions to improve understanding and address concerns about health effects known or believed to be caused by PFAS are available on EPA's PFAS Webpage.
During the 2020 CDR reporting cycle, 5,237 sites submitted 43,468 chemical-specific reports for 8,649 chemicals. Thus, for All Chemicals, 8,649 chemicals were reported. Of these, 33 were TSCA Risk Evaluation chemicals and 180 were PFAS (XLSX).
Number of CDR Sites by State
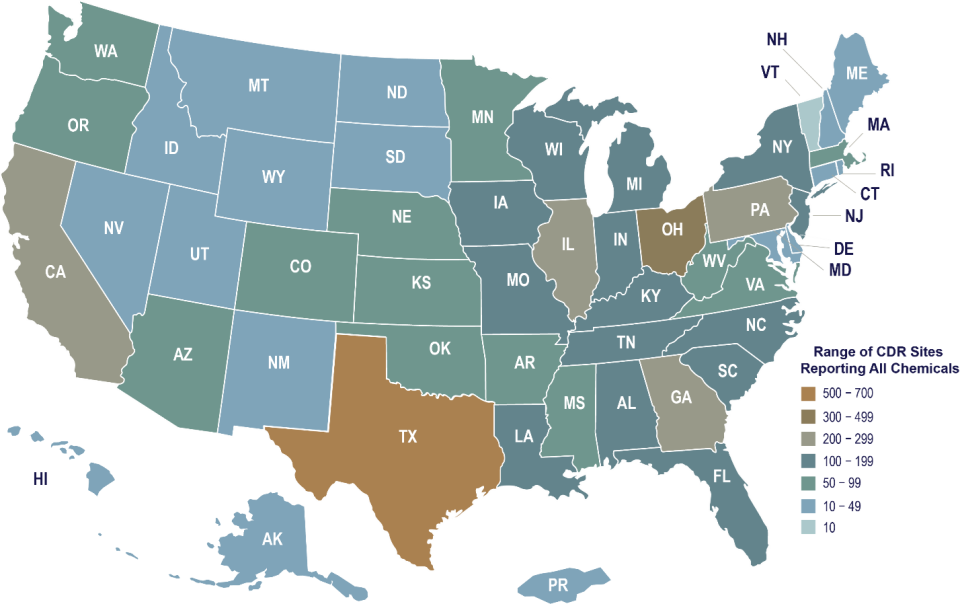
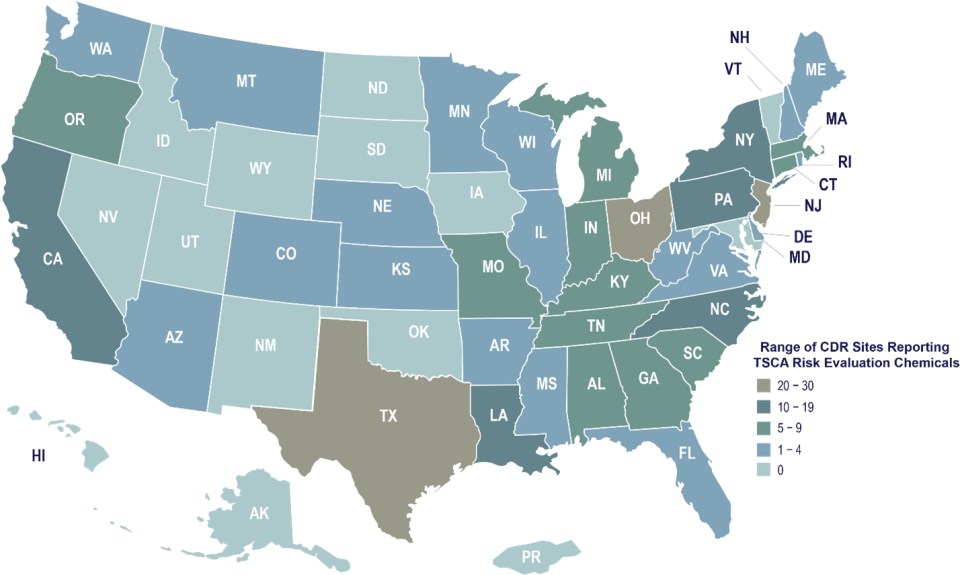
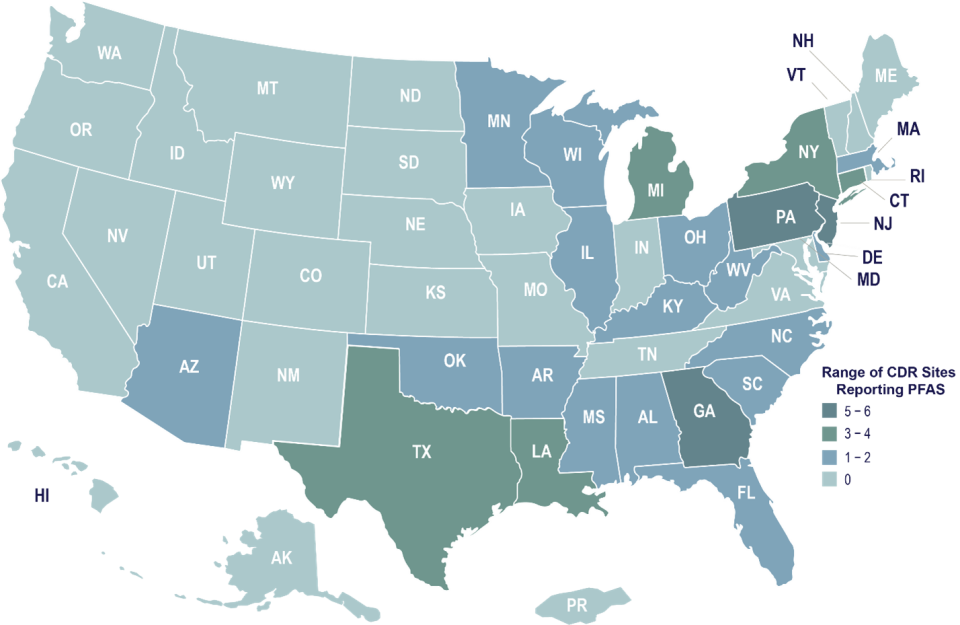
The maps below show ranges representing the site counts by state for each of the three chemical categories. The default view shows the CDR site count for all chemicals. Use the toggle button to view the details specific to each map.
2020 CDR Site Count – Reporting Information for All Chemicals

38 percent of the sites that reported for the 2020 CDR reporting cycle are located in 6 states: 13 percent in Texas and 25 percent in Ohio, Pennsylvania, California, Georgia, and Illinois combined.
2020 CDR Site Count – Reporting Information for TSCA Risk Evaluation Chemicals

A total of 254 sites reported chemicals that have or are undergoing risk evaluation by EPA (“TSCA Risk Evaluation Chemicals”) for the 2020 CDR Reporting Cycle. The sites reporting TSCA Risk Evaluation Chemicals are primarily concentrated in three states: Texas, New Jersey, and Ohio, which represent nearly 73 percent of all sites reporting TSCA Risk Evaluation Chemicals.
2020 CDR Site Count – Reporting Information for PFAS

A total of 57 sites reported PFAS for the 2020 CDR Reporting Cycle. The states with the most sites are represented as the range 5-6, are Georgia, Pennsylvania, and New Jersey. This covers 30% of all sites that reported for a PFAS. Considering the states with 3-4 sites reporting on PFAS covers an additional 26% of all sites that reported for a PFAS.
2020 CDR Data Summary
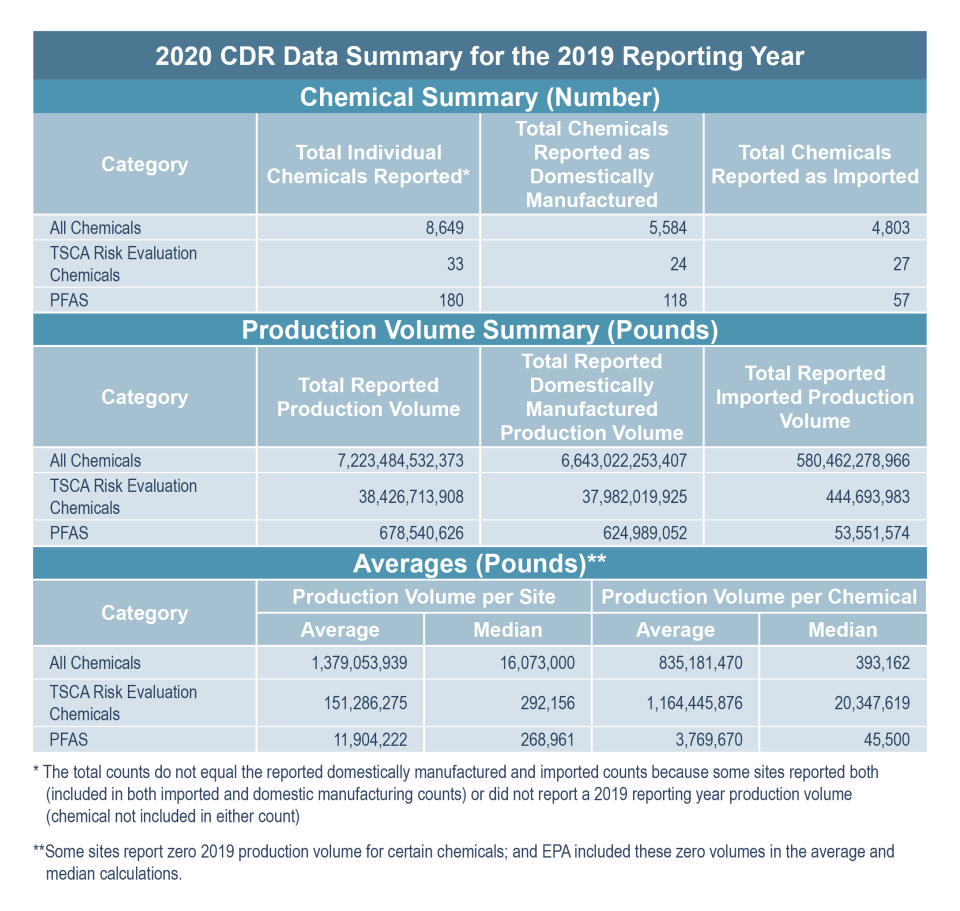
The table below shows the number of chemicals and production volume totals along with other details (quantities manufactured domestically versus quantities imported for each of the chemical categories).

» View larger image
- A total of 8,649 chemicals were reported to the CDR Program for the 2020 reporting cycle. Note that total number of chemicals represent individual counts and are not specific to manufacturing or import activity; some reporters indicated both domestic manufacture and import of the same chemical(s).
- Reporters indicated domestic manufacture of 5,584 specific chemicals and import of 4,803 specific chemicals.
- Of the chemicals reported, more than 7.223 trillion pounds were produced (i.e., domestically manufactured or imported) during 2019 alone. Most of this quantity (92%) was manufactured domestically and 78% is from two sectors: Petroleum and Coal Products Manufacturing (64%) and Chemical Manufacturing sectors (14%).
- The difference between the median and average values may be due to several factors, including production volume variations (outlier chemical and/or site production volumes), zero 2019 production volume, or number of chemicals or sites for a chemical group category (e.g., TSCA Risk Evaluation only includes 33 chemicals). For all chemicals, refer to table in Chemical Production Data.
- For the “All Chemicals” category, the average is significantly larger than the mean (right skewed) and can be attributed to sites that reported under NAICS 324 (Petroleum and Coal Products Manufacturing).
- The relatively high average and median production volume per chemical for TCSA Risk Evaluation Chemicals is largely driven by the 2019 total reported production volume for 1,2-dichloroethane, followed by the total production volumes for formaldehyde, 1,2-dichloropropane, octamethylcyclotetrasiloxane (D4), and perchloroethylene (also known as tetrachloroethylene).
1Three of the 33 TSCA Risk Evaluation Chemicals have more than one Chemical Abstracts Service Registry Number (CASRN). Di-isononyl phthalate has been assigned two CASRNs: 68515-48-0 and 28553-12-0. Similarly, di-isodecyl phthalate has been assigned two CASRNs: 68515-49-1 and 26761-40-0. Cyclic aliphatic bromide cluster is not a discrete chemical substance. It consists of three individual chemical substances: 1,1,2,2,3,3-hexabromocyclododecane (CASRN 25637-99-4); 1,2,5,6,9,10-hexabromocyclododecane (CASRN 3194-55-6); and 1,2,5,6-tetrabromocyclooctane (CASRN 3194-57-8).
