Climate Change Indicators: Great Lakes Ice Cover
This indicator measures the area and duration of ice cover in the Great Lakes.
Key Points
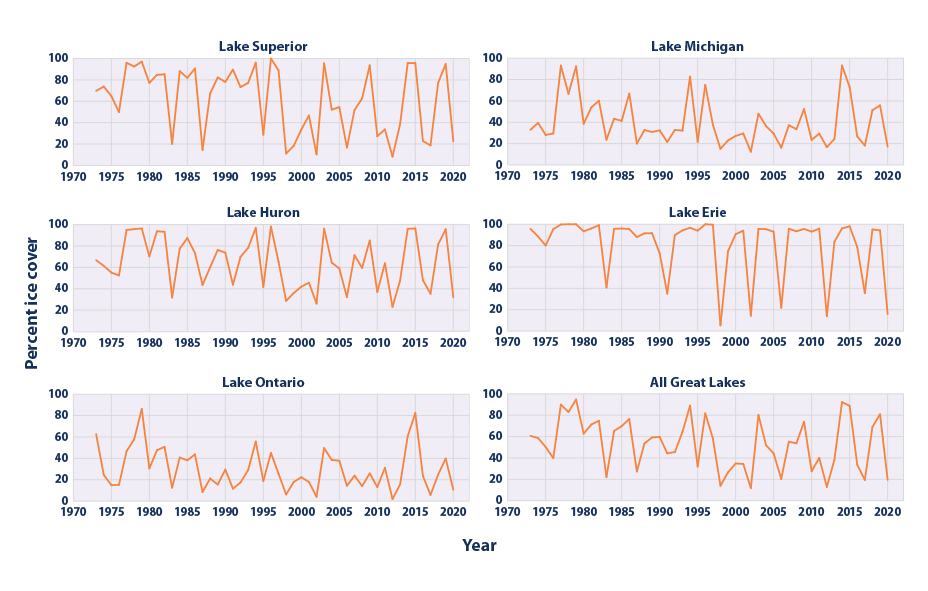
- Since 1973, the maximum area covered in ice on the Great Lakes has varied considerably from year to year. Adding the five Great Lakes together, maximum frozen area has ranged from less than 20 percent in some years to more than 90 percent in others (see Figure 1). All five lakes have experienced some degree of long-term decrease, but the decrease is only statistically significant in one lake (Superior). Years with much-lower-than-normal ice cover appear to have become more frequent during the past two decades, especially in lakes like Erie and Superior that have a history of freezing almost completely.
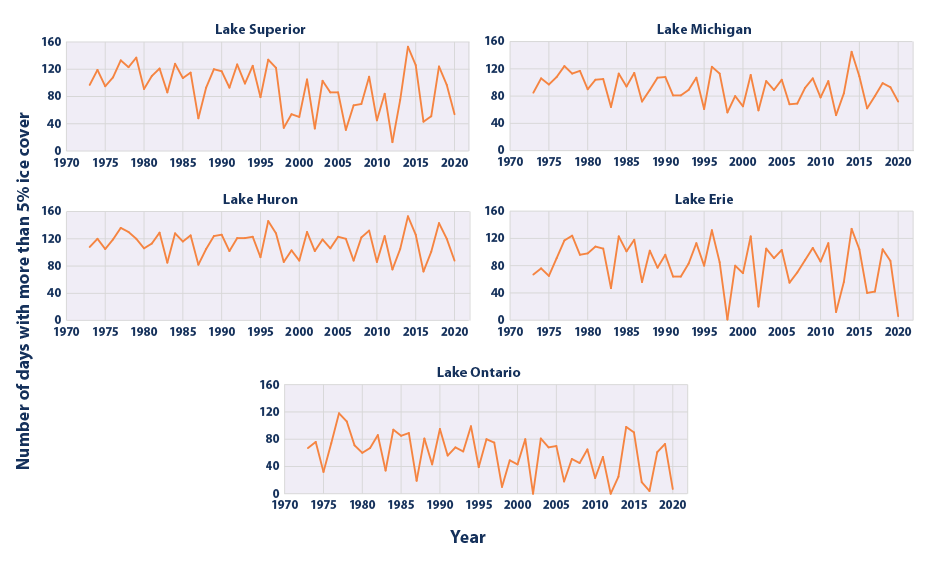
- Since 1973, the number of frozen days (duration) on all five Great Lakes has declined. Ice duration on these lakes has decreased at rates ranging from approximately one-fifth of a day per year in Lake Huron to almost a full day per year in Lakes Ontario and Superior (see Figure 2). Overall, this means the Great Lakes are frozen for eight to 46 fewer days now than they were in the early 1970s. The decreases in Lakes Ontario and Superior are statistically significant.
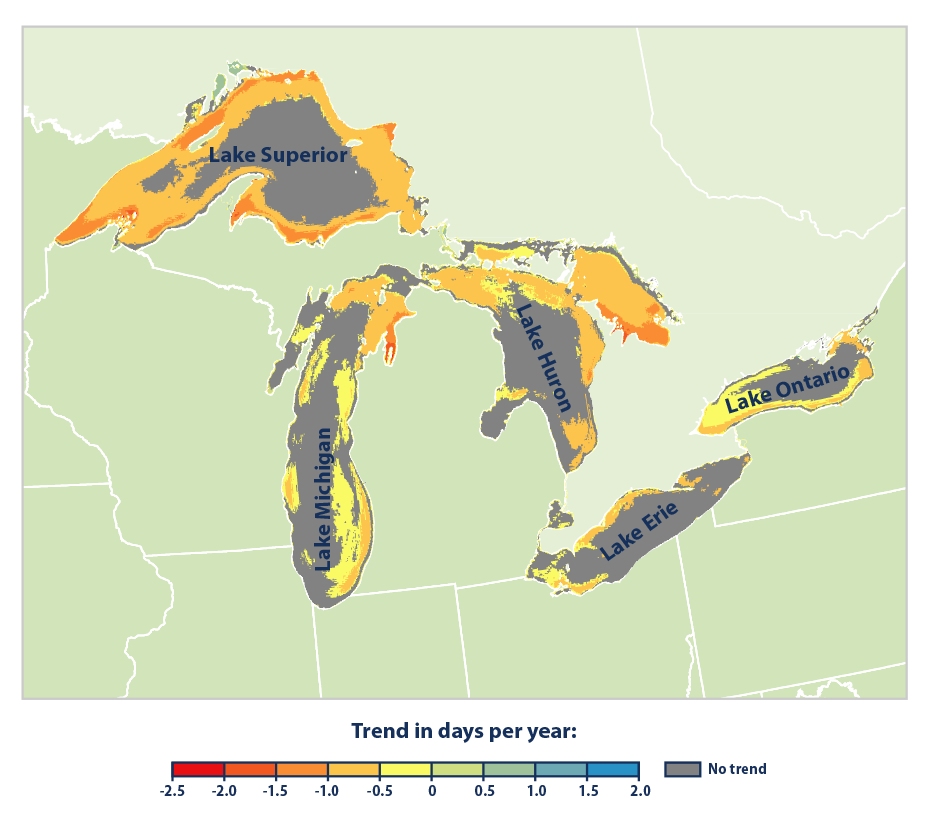
- A detailed map (see Figure 3) shows that many areas of the Great Lakes have experienced significant decreases in ice cover duration, but other parts of the lakes have not changed significantly. Duration has decreased the most in areas near the shore.
Background
The Great Lakes—Lake Superior, Lake Michigan, Lake Huron, Lake Erie, and Lake Ontario—form the largest group of freshwater lakes on Earth. These lakes support a variety of ecosystems and play a vital role in the economy of the eight neighboring states and the Canadian province of Ontario, providing drinking water, shipping lanes, fisheries, recreational opportunities, and more.
Parts of the Great Lakes typically freeze every winter. As the Earth’s climate changes, though, rising air temperatures (see the U.S. and Global Temperature indicator) and water temperatures (see the Great Lakes Water Levels and Temperatures indicator) have led to less ice cover on many lakes in North America, including the Great Lakes.1 Ice cover is expected to decline further as the climate continues to warm.2
The area that freezes and the length of time that the lakes remain frozen can have a wide range of effects on people and ecosystems. As with other lakes (see the Lake Ice indicator), ice cover on the Great Lakes can affect aquatic ecosystems, as well as recreational opportunities such as ice fishing. Due to the size of the Great Lakes, ice cover also plays an important role in regional weather patterns and the shipping industry. While reduced ice cover could lengthen the shipping season, it also allows more water to evaporate from the lakes, which can lead to lower water levels (see the Great Lakes Water Levels and Temperatures indicator) and restrict shipping channels.3 More evaporation can also lead to an increase in precipitation over nearby land, especially “lake effect” snow (see the Snowfall indicator).4
About the Indicator
This indicator presents two related ways of measuring ice cover in the Great Lakes: area (the percentage of the lake surface area that is frozen) and duration (the length of time the lakes stay frozen). Both parts of this indicator are based on daily and weekly charts and maps created by the Canadian Ice Service and the U.S. National Ice Center, which are derived from a long-running collection of observations from ships, shore, aircraft, and satellites. Complete data are available back to 1973 for each lake.
Figure 1 shows the maximum portion of each lake’s surface area that was frozen in each year. Figure 2 tracks duration by showing the total number of days per year in which at least 5 percent of the lake surface was frozen. In each case, the period analyzed runs from December through May, with this entire “season” considered part of the same year. For example, “2020” represents conditions from December 2019 through May 2020.
The map in Figure 3 shows how the length of time the Great Lakes stay frozen has changed over time, and how these changes vary by location. Data for this part of the indicator were available through 2019. Figure 3 only shows a rate of change for pixels where the trend is statistically significant.
About the Data
Indicator Notes
Temperature trends influence ice-covered area and duration, but natural year-to-year variations and decadal climate cycles may play a bigger role.8,9 With more than four decades of data, though, this indicator clearly shows meaningful long-term trends and variations that relate to the regional climate of the Great Lakes, which is linked to broader global weather and climate patterns.10,11
Data Sources
Ice cover area and duration data were provided by the National Oceanic and Atmospheric Administration’s Great Lakes Environmental Research Laboratory at: www.glerl.noaa.gov/data/ice/#historical. Similar data can be downloaded from the Great Lakes Aquatic Habitat Framework website at: www.glahf.org/data.
Technical Documentation
References
1 Angel, J., C. Swanston, B.M. Boustead, K.C. Conlon, K.R. Hall, J.L. Jorns, K.E. Kunkel, M.C. Lemos, B. Lofgren, T.A. Ontl, J. Posey, K. Stone, G. Takle, and D. Todey. 2018. Midwest. In: USGCRP (U.S. Global Change Research Program). 2018. Impacts, risks, and adaptation in the United States: Fourth National Climate Assessment, volume II. Reidmiller, D.R., C.W. Avery, D.R. Easterling, K.E. Kunkel, K.L.M. Lewis, T.K. Maycock, and B.C. Stewart (eds.). https://nca2018.globalchange.gov. doi:10.7930/NCA4.2018.
2 USGCRP (U.S. Global Change Research Program). 2018. Impacts, risks, and adaptation in the United States: Fourth National Climate Assessment, volume II. Reidmiller, D.R., C.W. Avery, D.R. Easterling, K.E. Kunkel, K.L.M. Lewis, T.K. Maycock, and B.C. Stewart (eds.). https://nca2018.globalchange.gov. doi:10.7930/NCA4.2018
3 Angel, J., C. Swanston, B.M. Boustead, K.C. Conlon, K.R. Hall, J.L. Jorns, K.E. Kunkel, M.C. Lemos, B. Lofgren, T.A. Ontl, J. Posey, K. Stone, G. Takle, and D. Todey. 2018. Midwest. In: USGCRP (U.S. Global Change Research Program). 2018. Impacts, risks, and adaptation in the United States: Fourth National Climate Assessment, volume II. Reidmiller, D.R., C.W. Avery, D.R. Easterling, K.E. Kunkel, K.L.M. Lewis, T.K. Maycock, and B.C. Stewart (eds.). https://nca2018.globalchange.gov. doi:10.7930/NCA4.2018
4 Burnett, A.W., M.E. Kirby, H.T. Mullins, and W.P. Patterson. 2003. Increasing Great Lake-effect snowfall during the twentieth century: A regional response to global warming? J. Climate 16:3535–3542
5 NOAA (National Oceanic and Atmospheric Administration). 2021. Great Lakes Environmental Research Laboratory: Historical ice cover. Accessed March 2021. www.glerl.noaa.gov/data/ice/#historical.
6 NOAA (National Oceanic and Atmospheric Administration). 2021. Great Lakes Environmental Research Laboratory: Historical ice cover. Accessed March 2021. www.glerl.noaa.gov/data/ice/#historical.
7 NOAA (National Oceanic and Atmospheric Administration). 2019. Great Lakes Environmental Research Laboratory: Historical ice cover. Accessed December 2019. www.glerl.noaa.gov/data/ice/#historical.
8 Wang, J., X. Bai, H. Hu, A. Clites, M. Colton, and B. Lofgren. 2012b. Temporal and spatial variability of Great Lakes ice cover, 1973–2010. J. Climate 25(4):1318–1329. https://journals.ametsoc.org/view/journals/clim/25/4/2011jcli4066.1.xml. doi:10.1175/2011JCL14066.1.
9 Wang, J., R.A. Assel, S. Walterscheid, A.H. Clites, and X. Bai. 2012a. Great Lakes ice cover climatology update: Winters 2006–2011 description of the digital ice cover data set. NOAA Technical Memorandum GLERL-155. www.glerl.noaa.gov/pubs/tech_reports/glerl-155/tm-155.pdf.
10 Bai, X., J. Wang, C. Sellinger, A. Clites, and R. Assel. 2012. Interannual variability of Great Lakes ice cover and its relationship to NAO and ENSO. J. Geophys. Res. 117:C03002. https://agupubs.onlinelibrary.wiley.com/doi/full/10.1029/2010JC006932. doi:10.1029/2010JC006932.
11 Wang, J., R.A. Assel, S. Walterscheid, A.H. Clites, and X. Bai. 2012. Great Lakes ice cover climatology update: Winters 2006–2011 description of the digital ice cover data set. NOAA Technical Memorandum GLERL-155. www.glerl.noaa.gov/pubs/tech_reports/glerl-155/tm-155.pdf.

