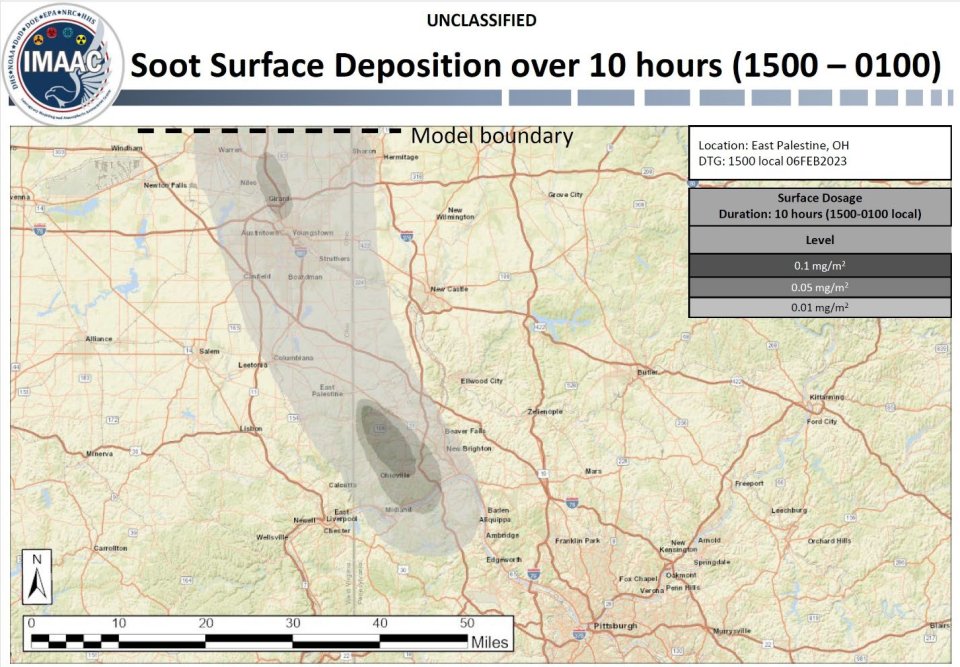
Event Reconstruction Plume Map
To support Unified Command efforts to evaluate soils most likely impacted by smoke and soot from the February 6, 2023 “vent and burn” operation, EPA requested an event reconstruction model and map from the Interagency Modeling and Atmospheric Assessment Center (IMAAC) that shows the smoke plume and resulting soot surface deposition.
The map, shown below, estimates the extent and concentration of soot deposited into the environment throughout the plume area, which is located within areas of both Ohio and Pennsylvania.
The map shows that the highest estimated concentration of soot (0.1 mg/m2) is downwind from the derailment site over a roughly 8-mile by 2-mile area in western Pennsylvania. This concentration is approximately equal to 0.014 ounces of soot per acre of land.

Refer to the Technical Memo for more information, assumptions and caveats of this map and model:
Technical Memo re IMAAC Retrospective Analysis of East Palestine Train Derailment (pdf)
As a result of the model, the Phase 1 Residential/Commercial/Agricultural Soil Sampling Plan was amended to target properties in the area of highest estimated soot concentration. The Pennsylvania Department of Environmental Protection (PA DEP), in coordination with EPA, expanded sampling efforts even further.
The sample results indicate that impacts from the smoke and soot were minimal. One of the families of chemicals sampled for were dioxins and furans. A summary of the data from the 0.1 mg/m2 map area is below. All results fall within typical background ranges for rural and urban soils.
| Analyte | # Samples | Avg | Min | Max | |
|---|---|---|---|---|---|
| Phase 1 | Total Toxic Dioxins and Furans | 22 | 4.63E-06 | 2.40E-06 | 1.70E-05 |
| PA DEP Additional | Total TEQ | 19 | 3.30E-06 | 3.71E-07 | 6.76E-06 |
| Overall | TEQ* | 41 | 4.02E-06 | 3.71E-07 | 1.70E-05 |
Toxic equivalency (TEQ) values are based on the World Health Organization (WHO) 2005 toxic equivalency factors. The results between the sampling efforts may vary slightly based on how non-detect data were factored into the calculations. TEQs are a weighted quantity measure based on the toxicity of each member of the dioxin and dioxin-like compounds category relative to the most toxic members of the category. Learn more about dioxin and dioxin-like compounds TEQ.
Interpreting Results Example: 4.63E-06 mg/kg = 4.63 x 10-6 = 4.63 ppt
Terms Key
| mg/kg | Milligrams per kilograms |
|---|---|
| mg/m2 | Milligrams per aquare meter |
| ppt | Parts per trillion |
