ExpoKids: Tools and Resources
On this page:
- ExpoKids (Downloadable R Code)
- ExpoKids Online Application
- ExpoKids User Manual
- Journal Article
- Datasets
Tools
ExpoKids R (Downloadable R Code)
ExpoKids R Shiny (Online Application)
ExpoKids Online allows you to create aggregate exposure graphs in your web browser. ExpoKids Online is a web-based version of the R software tool that doesn't require you to install R on your computer to generate the ExpoKids graphs. Start by downloading the sample data spreadsheet and then reload it into ExpoKids Online with your updates and you'll be able to review and save the graphs.
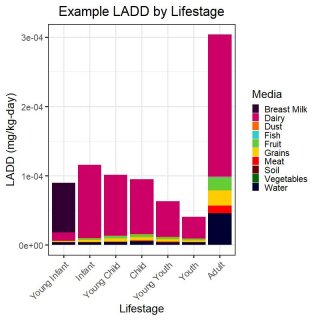
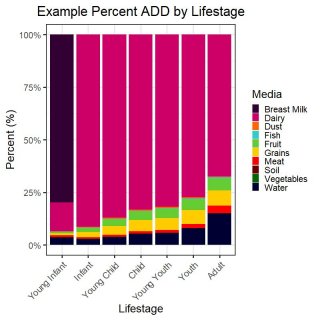
ExpoKids Online can generate five different graph types from loaded data (see link to sample data table, under Datasets) were used to produce graphs for the following lifestages:
- Average Daily Dose (ADD) by lifestage
- Lifetime Average Daily Dose (LADD) by lifestage
- ADD for an individual exposure pathway by lifestage
- LADD for an individual exposure pathway by lifestage
- Percent ADD by lifestage
See the following illustrations of output samples of ExpoKids graphs based on the list above:
Resources
EPA Report
Journal Article
- ExpoKids: An R-Based Tool for Characterizing Aggregate Environmental Exposure During Childhood. M. Dai, S. Euling, L. Phillips, and G. Rice. JESEE, 2020. Available at: https://www.nature.com/articles/s41370-020-00265-6
Datasets
ExpoKids R Tool Datasets


