Lean & Energy Toolkit: Chapter 4
Energy and Greenhouse Gas Assessment Strategies
- Observe Energy Use on the Shop Floor
- Energy Audits and Measuring Energy Use
- To Consider (1)
- Greenhouse Gas Inventories
- Examine Energy Use with Value Stream Mapping
- Use Six Sigma to Find and Eliminate Energy Waste and Variation
- To Consider (2)
- Footnotes
- Toolkit Navigation
Observe Energy Use on the Shop Floor
Walking through and observing processes as they actually run at a facility can be a simple but effective way to identify waste and find improvement

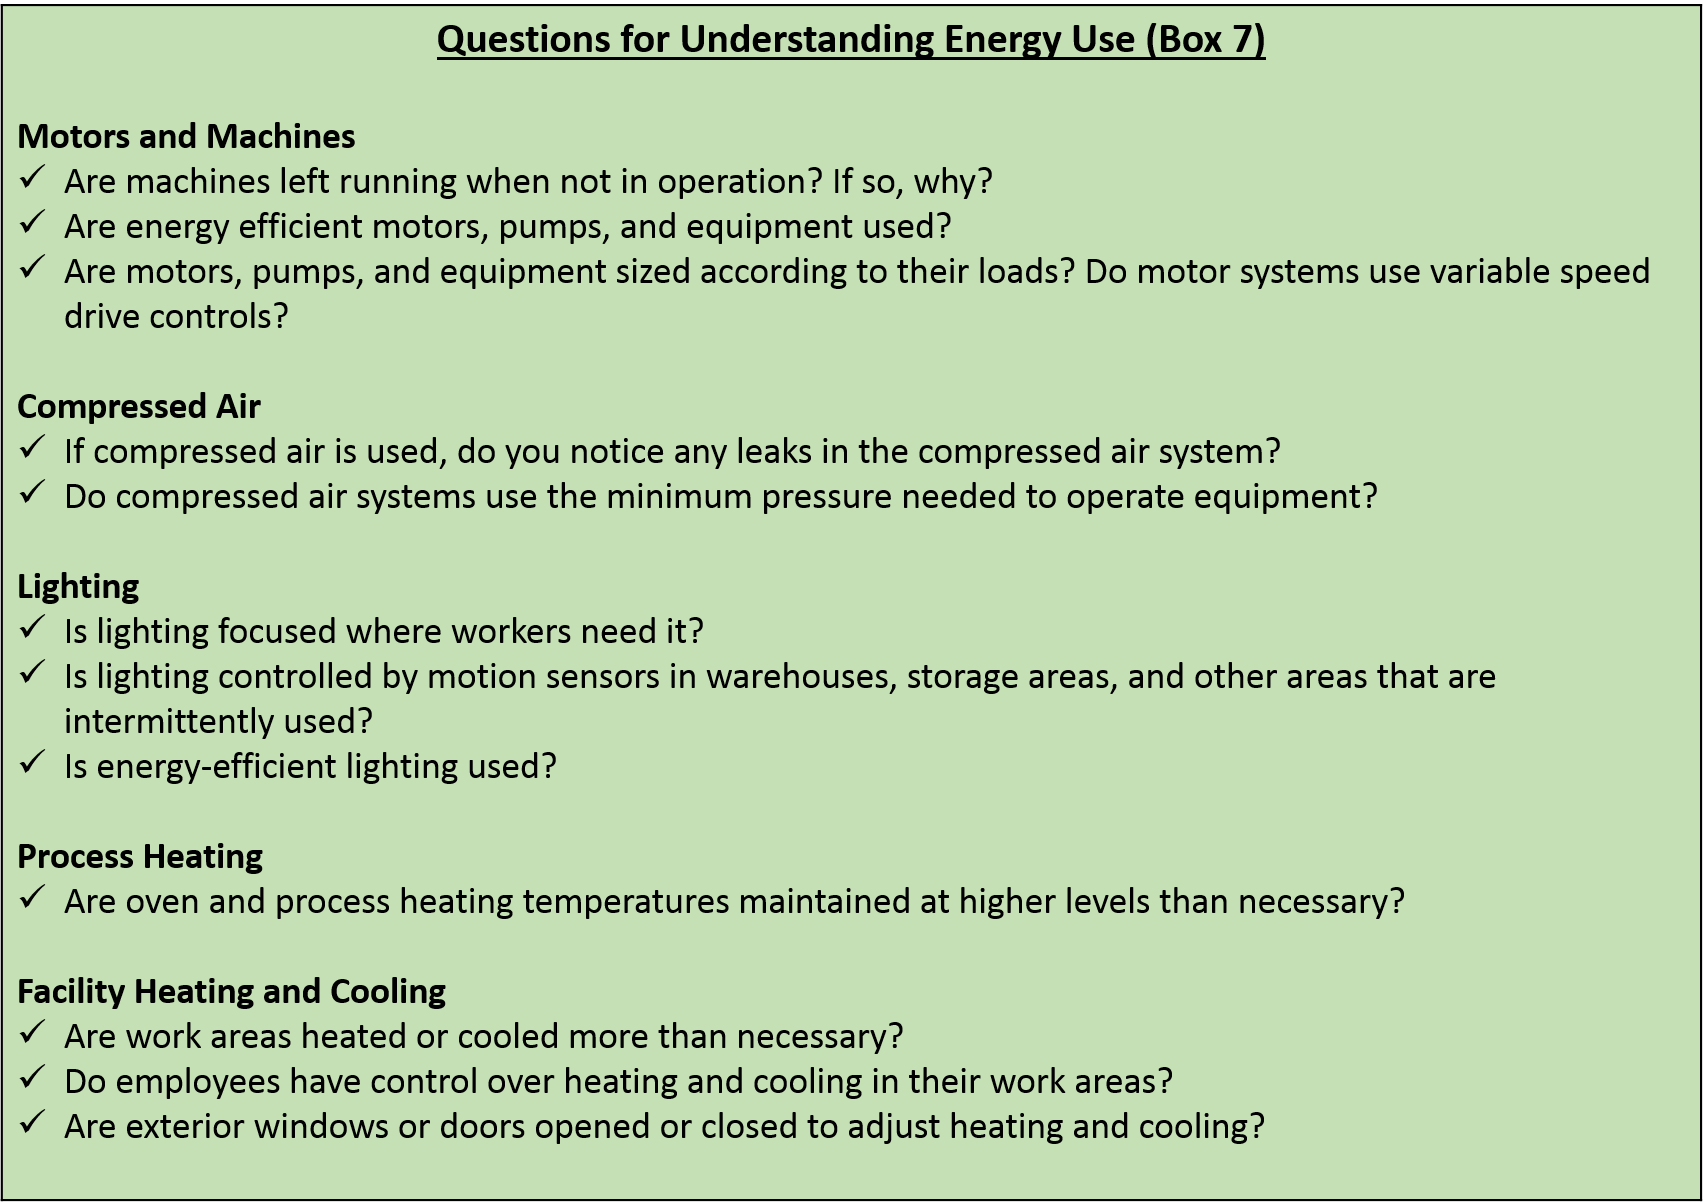
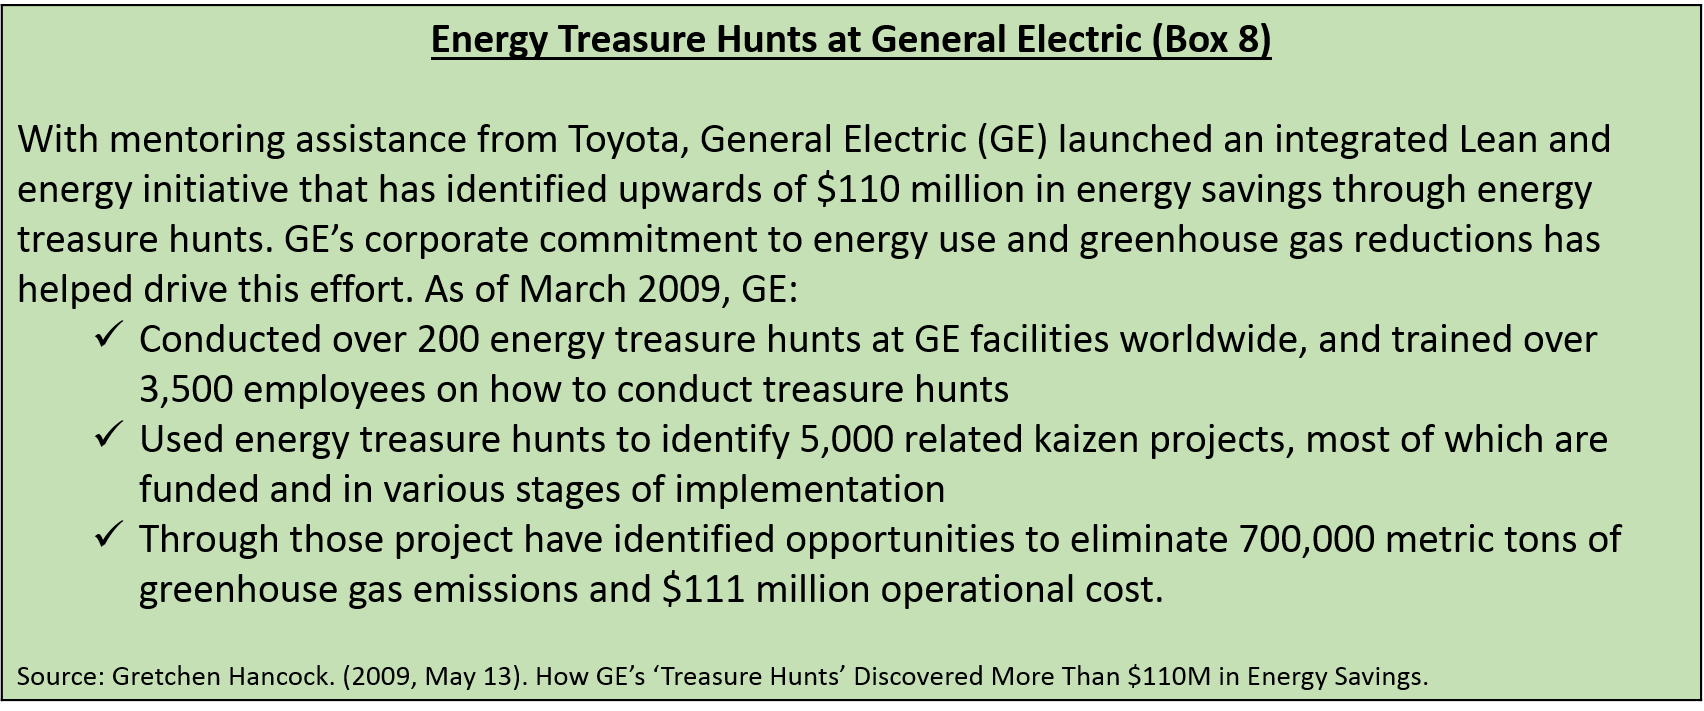
Walk-throughs are a key step in value stream mapping and other Lean activities. Companies such as Toyota and GE frequently conduct “Energy Treasure Hunts” to find energy savings (see Box 8). An Energy Treasure Hunt is a three-day plant assessment event in which a cross-functional team of
employees identifies opportunities to reduce unnecessary energy use. Project teams then implement the ideas that are likely to yield the greatest benefits through kaizen events.
Energy Audits and Measuring Energy Use
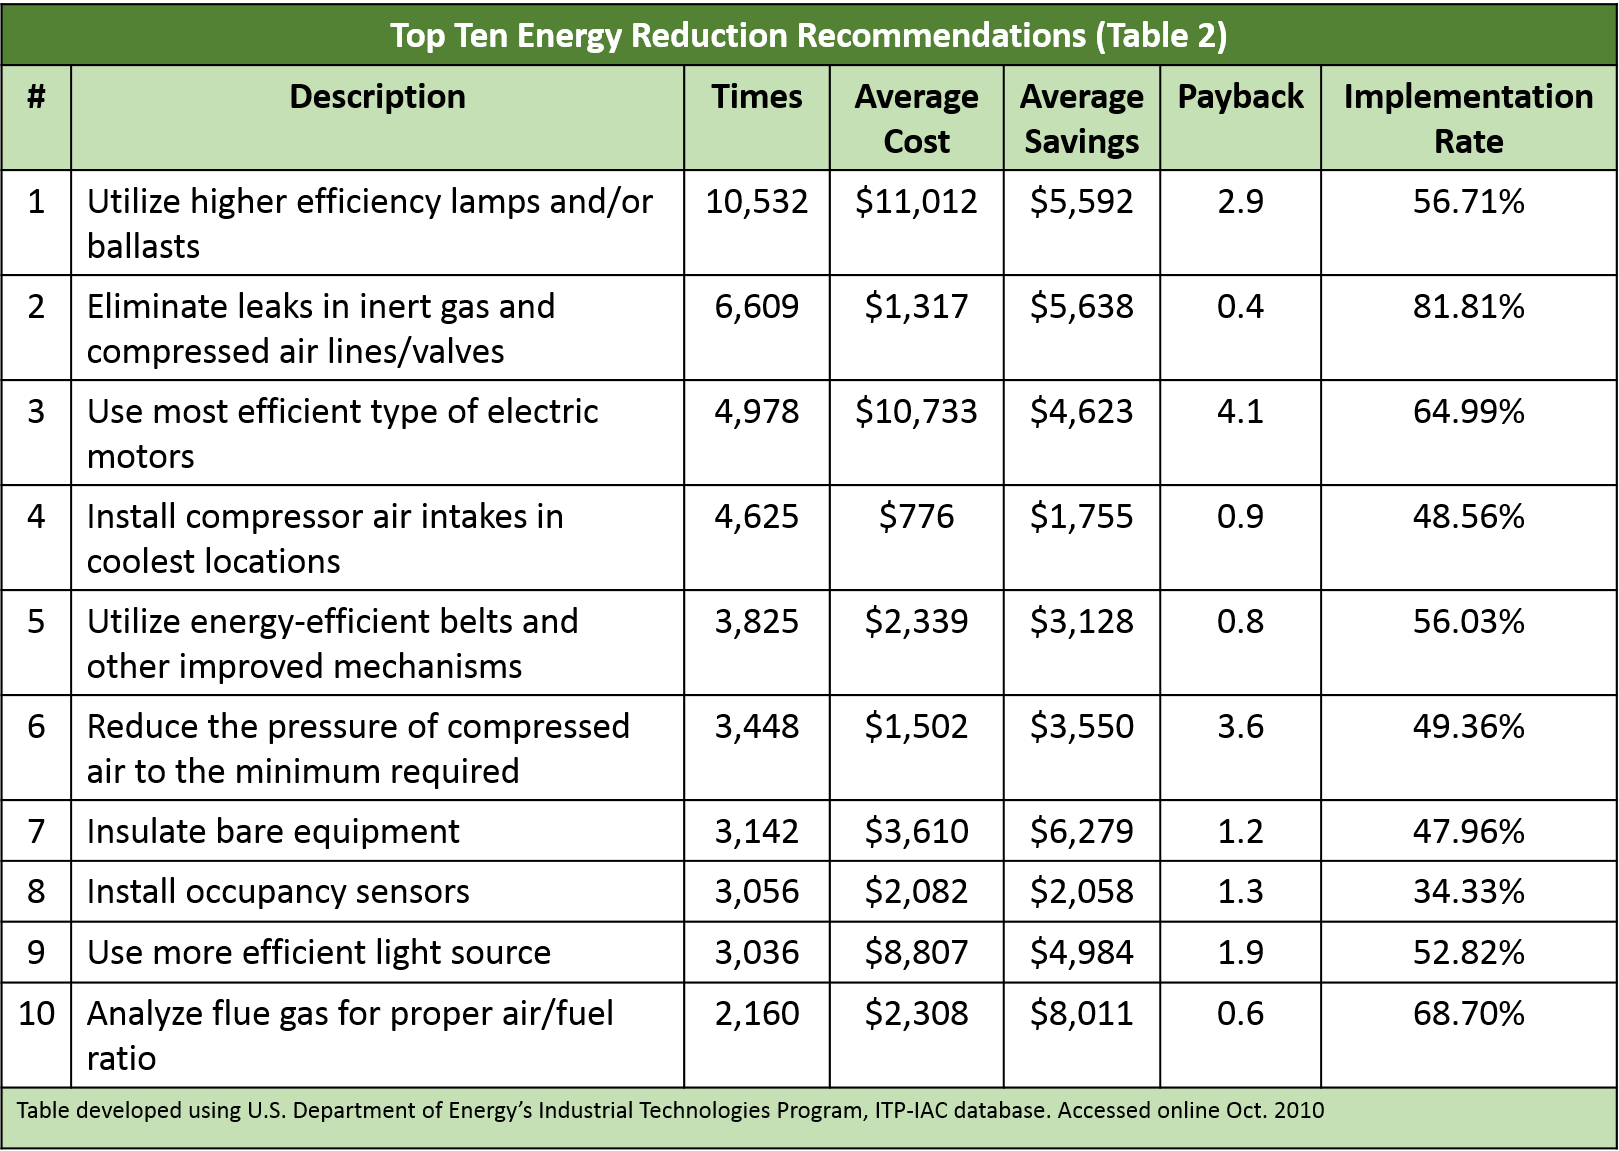
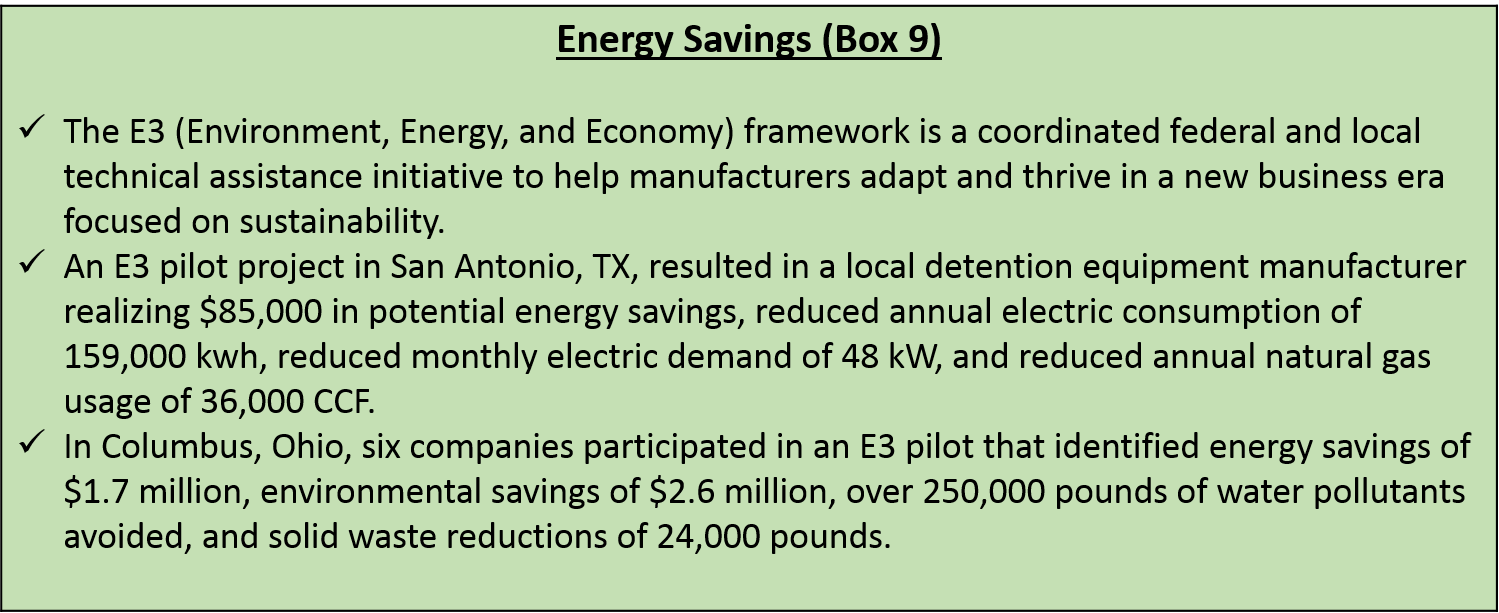
While a walk-through is an excellent way to identify and fix energy wastes that are clearly visible, you may still want to examine energy use more closely. Two strategies for learning more include:
- Conducting an energy audit to understand how energy is used—and possibly wasted—across your facility.
- Measuring the energy use of individual production and support processes.
Energy Audits

Measuring Energy Use of Individual Processes
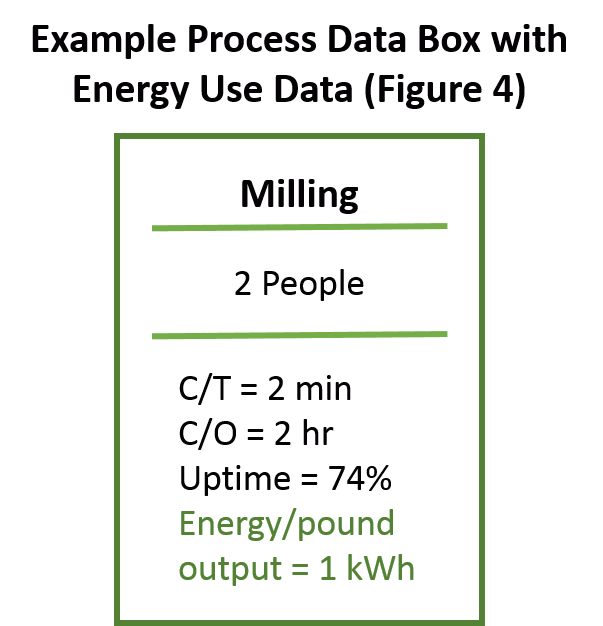
You may not really know which process or process step uses the most energy—and therefore where the greatest energy savings might be - until you actually measure the energy use. During the analysis of the “current state” of a value stream or an individual process, collect data on how much energy each operation uses. Typical energy metrics include:
- Kilowatt-hours (for electricity)
- Therms (for natural gas)
- British thermal units (Btu)
- Energy intensity (energy use per production unit)
- Energy costs (dollar amount spent on energy)
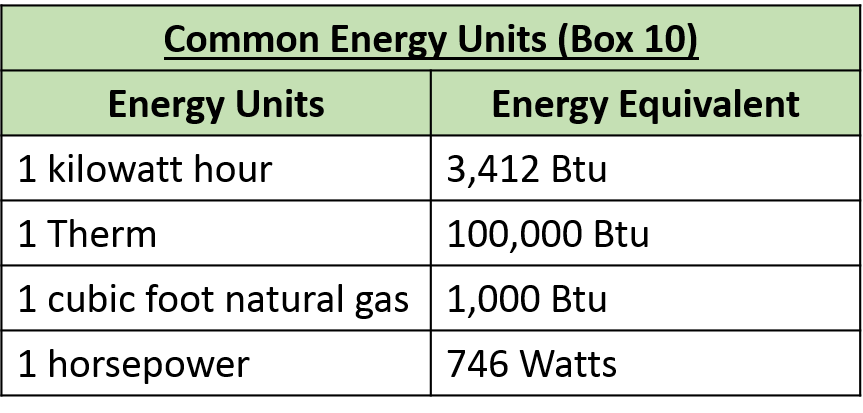
- Metering: One technique is to install meters to track the energy use of a process. For example, install a flow meter to track natural gas inputs to ovens that provide process heat, or install electric meters in a particular process area to monitor electricity use. Metering enables a facility to track energy use over short and longer time periods.
- Estimating: Another technique is to estimate energy use based on information provided by equipment manufacturers. Calculate energy use for specific equipment or process activities using equipment energy specifications coupled with equipment operation data (e.g., number of hours the equipment is in different modes of operation). While such calculations are often not precise, they can indicate the order of magnitude of energy use.
- Energy Studies: Energy specialists can also help conduct detailed analyses of energy use and costs at both the facility level and the process level. This type of analysis can look not only at where and how much energy is used, but also opportunities to reduce energy costs through load shifting (shifting electricity use to off-peak times), changing the mix of energy sources, and other strategies.
Greenhouse Gas Inventories
In addition to energy use, your organization may also want to look at your overall impact on global climate change. Corporate greenhouse gas inventories help your company identify where emission reduction opportunities exist. A greenhouse gas inventory is simply an accounting of the amount of greenhouse gas emissions emitted to or removed from the atmosphere over a given period of time. Corporate greenhouse gas inventories focus specifically on the emissions of a company.


- Carbon Dioxide (CO2): Carbon dioxide enters the atmosphere through the burning of fossil fuels (oil, natural gas, and coal), solid waste, trees and wood products, and also as a result of other chemical reactions (e.g., manufacture of cement). Carbon dioxide is also removed from the atmosphere (or “sequestered”) when it is absorbed by plants as part of the biological carbon cycle.
- Methane (CH4): Methane is emitted during the production and transport of coal, natural gas, and oil. Methane emissions also result from livestock and other agricultural practices and by the decay of organic waste in municipal solid waste landfills.
- Nitrous Oxide (N2O): Nitrous oxide is emitted during agricultural and industrial activities, as well as during combustion of fossil fuels and solid waste.
- Fluorinated Gases: Hydrofluorocarbons, perfluorocarbons, and sulfur hexafluoride are synthetic, powerful greenhouse gases that are emitted from a variety of industrial processes. Fluorinated gases are sometimes used as substitutes for ozone-depleting substances (i.e., CFCs, HCFCs, and halons). These gases are typically emitted in smaller quantities, but because they are potent greenhouse gases, they are sometimes referred to as High Global Warming Potential gases (High GWP gases).

Typically, when you reduce your energy use, you are also reducing your greenhouse gas emissions, but there are additional improvements that can be made to further reduce your company’s global warming impact such as switching to fuel that emits fewer greenhouse gas emissions. Lean activities can be targeted at processes with high greenhouse gas emissions, or greenhouse gas emissions can simply be calculated in addition to energy efficiency reductions. This is just one more metric that could be calculated as part of a Lean and Energy event.
Examine Energy Use with Value Stream Mapping

Adding Energy Analysis to Value Stream Mapping
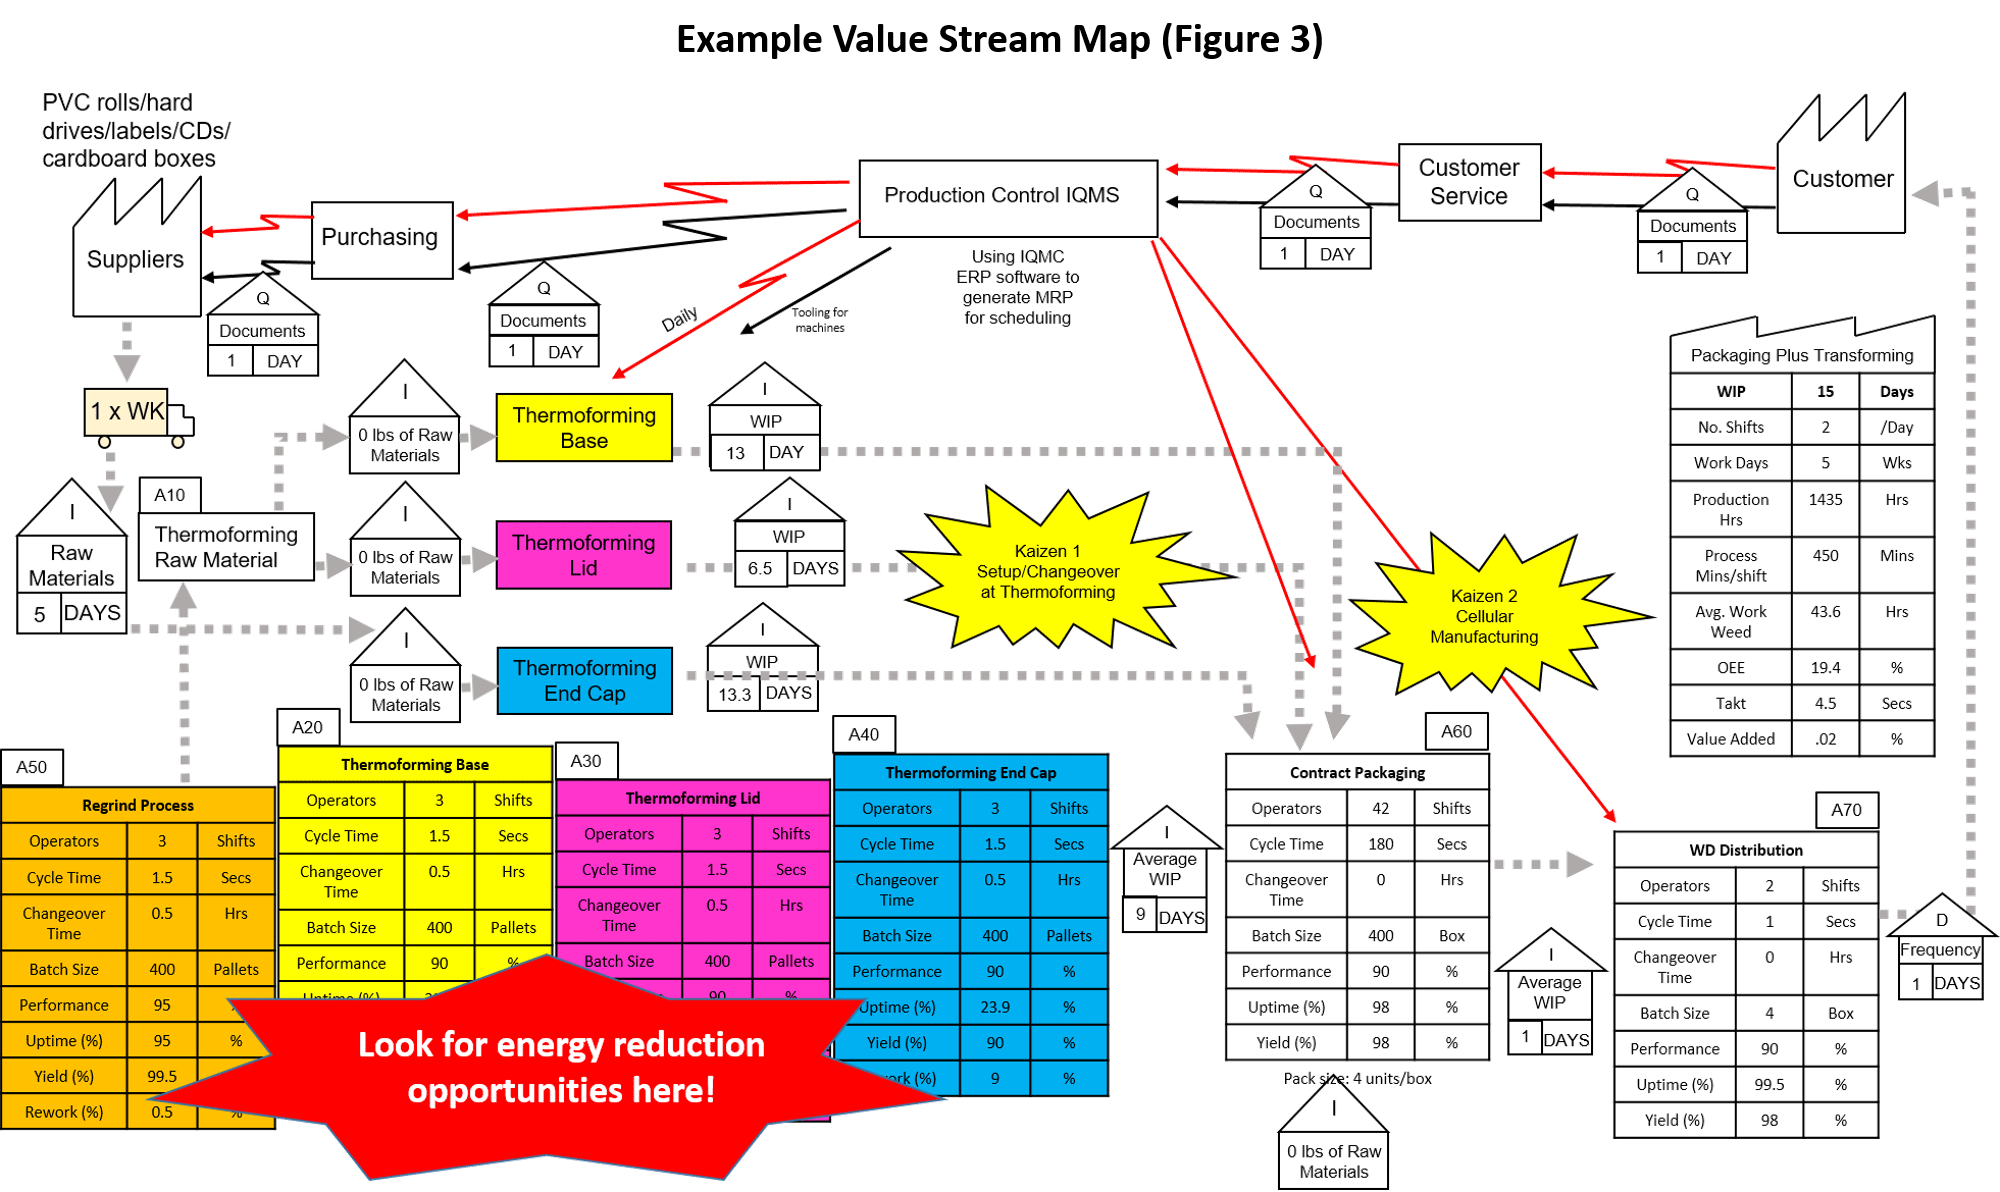
Your value stream mapping team can examine the energy use of processes in a value stream at the same time your team examines other data about the “current state,” including Lean metrics such as cycle time (C/T), changeover time (C/O), and uptime. Use the techniques described previously for observing and measuring energy use to collect energy data for processes in the value stream, or consider asking internal or outside experts to assist with the energy analysis. This may involve collecting baseline data in advance of a value stream mapping event.
The key is to have both Lean and energy use data available when your value stream mapping team brainstorms and prioritizes improvement ideas for the “future state” of the value stream. This will leverage the whole systems thinking of Lean to maximize operational gains and energy savings. Figure 3: Example Value Stream Map shows a value stream map from a value and energy stream mapping project.


Identifying Opportunities
Incorporating energy analysis into value stream mapping allows your team to consider energy reduction opportunities alongside other process improvement opportunities. You may find ways to reduce energy use that will also provide other production benefits, such as fewer defects from more reliable equipment. When you look at energy use in the context of the entire value stream, ask two fundamental questions:
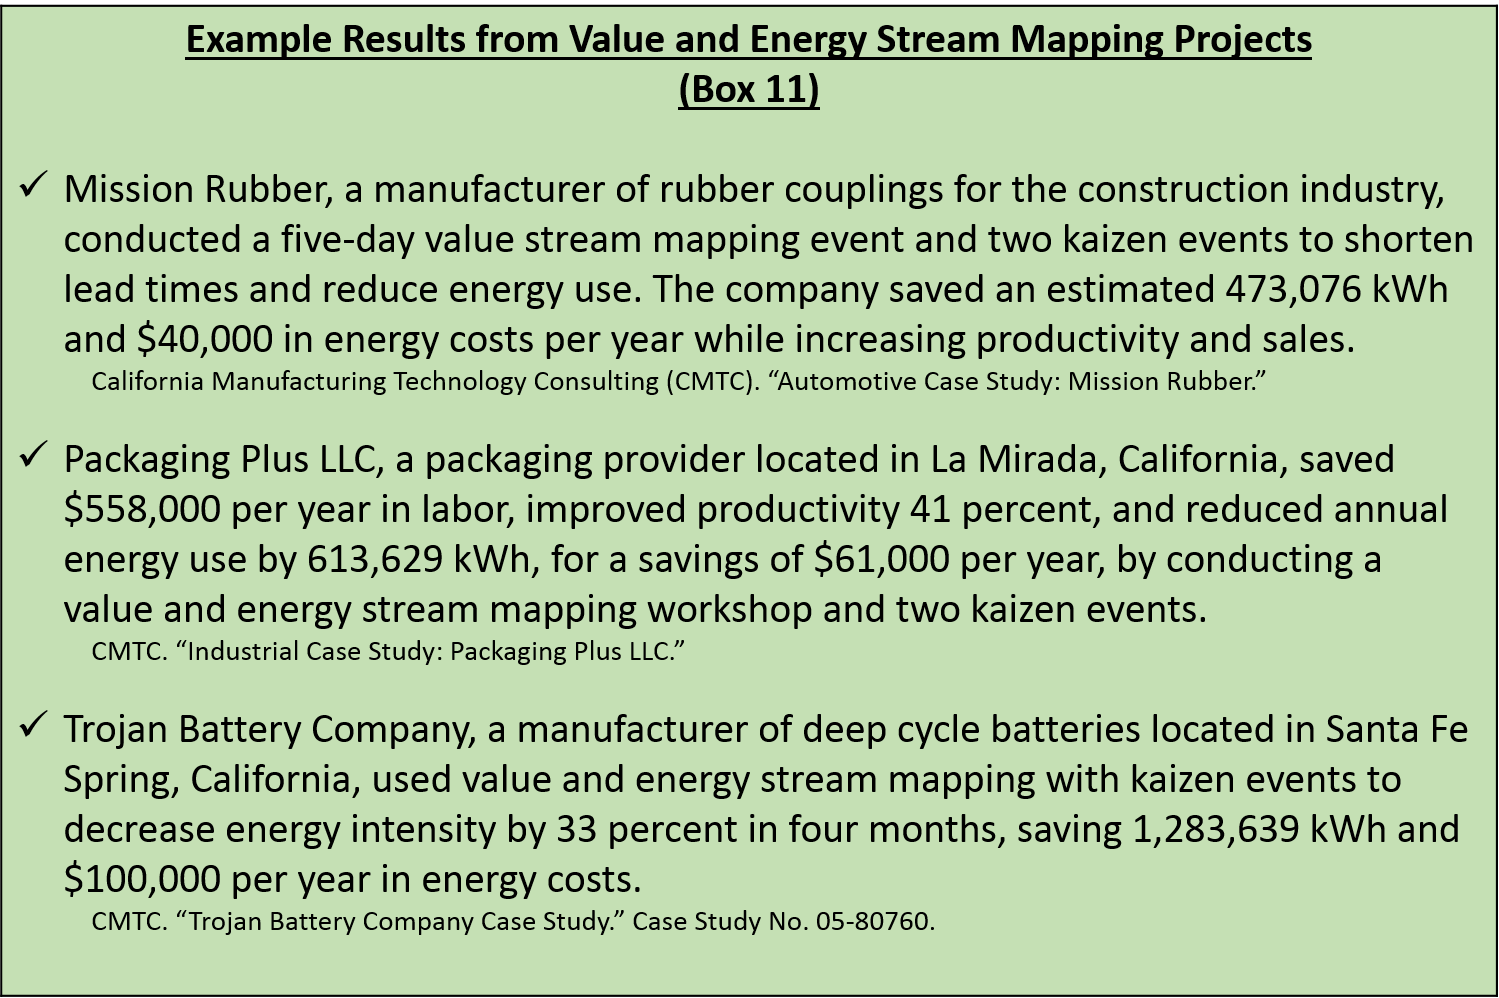
- Is this energy end use needed? Eliminating entire energy end uses can result in substantial cost savings, improve production flow, and simplify processes. For example, when planning for a Lean and environment kaizen event, a Lasco Bathware manufacturing plant found it could eliminate a shrink-wrap heating oven. This resulted in an annual savings of $99,290 and 12.6 million cubic feet of natural gas.1
- Is there a way to deliver this end use more efficiently in support processes? Support processes may consume significant amounts of energy. Even

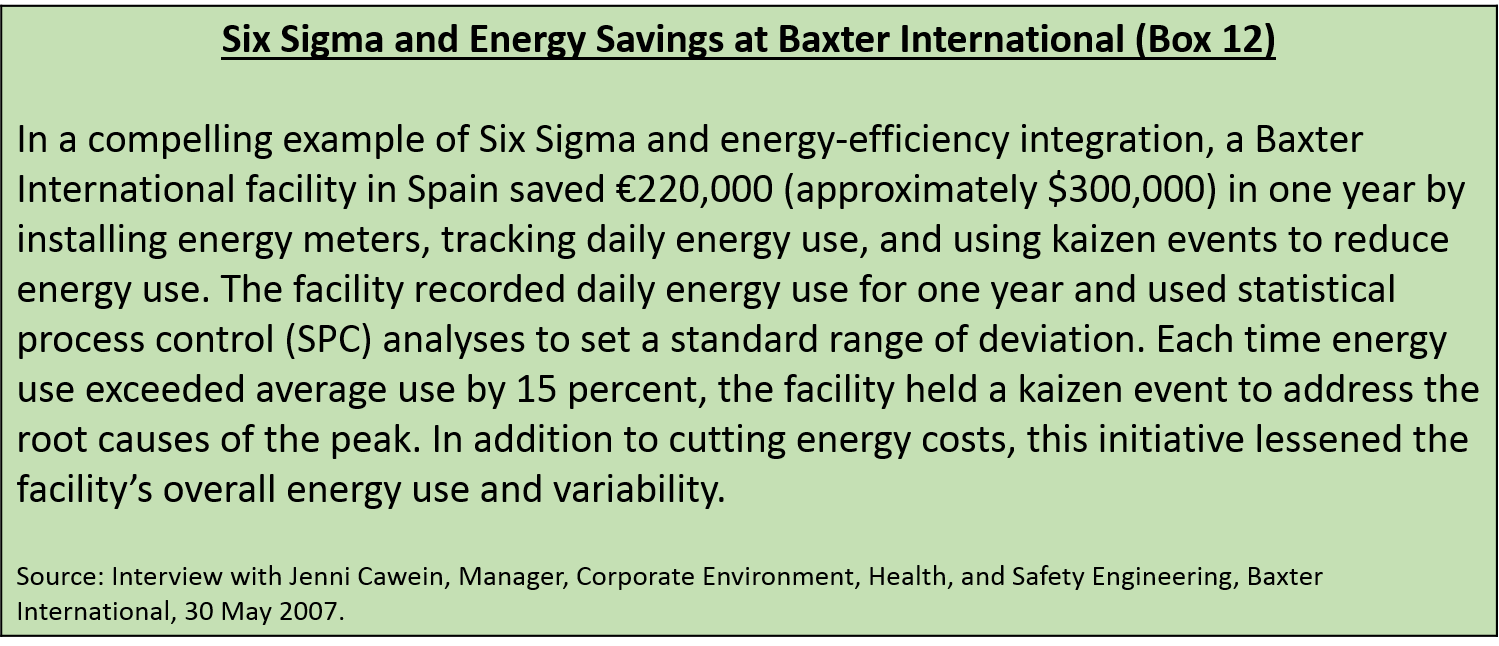
Use Six Sigma to Find and Eliminate Energy Waste and Variation

Lean Six Sigma helped the 3M Company reduced worldwide energy use by 46 percent (when indexed to net sales) from 2000 to 2010. 3M set a corporate goal for further energy use reductions of 25 percent for the period from 2005 to 2015, and the company views Lean Six Sigma as critical to realizing this performance goal1.
Footnotes
1 3M Corporation. Sustainability at 3M.
Toolkit Navigation
- Contents & Acknowledgements
- Executive Summary
- Preface
- Chapter 1: Introduction
- Chapter 2: Integrating Lean, Energy Efficiency and Greenhouse Gas Management
- Chapter 3: Overview of Energy Use and Lean
- Chapter 4: Energy and Greenhouse Gas Assessment Strategies
- Chapter 5: Energy and Greenhouse Gas Emission Reduction Tools and Strategies
- Chapter 6: Conclusion
- Appendix A: Energy and Greenhouse Gas Management Service Providers, Resources and Tools
- Appendix B: Sector-Focused Energy Reduction and Greenhouse Gas Management Resources
- Appendix C: Energy Conversion Resources and Rules of Thumb for Estimating Energy Cost Savings
